Hi, I’m @VizScientist ! I’ve spent countless hours building custom data visuals with code, and I know how frustrating it can be. That’s why I’m creating a tool to make it easier for everyone to design stunning visuals. Follow along as I build it! 🚀
What do you think? Does this chart deserve the roast? Or have you seen worse offenders in the wild?
Let’s chat about making data visualization more impactful. Share your thoughts below! 📊🔥
#datavisualization#DataAnalytics#dataviz
Roast This Chart :
A visualization of marketing campaign types—Email Campaigns, Social Media Campaigns, and Video Ads—from 2018 & 2019. Harder to interpret than it should be.
FYI, the data's fake, but the roast is very real. Let’s break it down and see where it went wrong.
The Roast Verdict: This chart looks pretty, but it buries the story under its design.
To fix it:
✅ Add totals/absolute numbers.
✅ Use a bar chart for easier comparisons.
✅ Define categories clearly.
✅ Highlight key trends (e.g., Social Media growth).
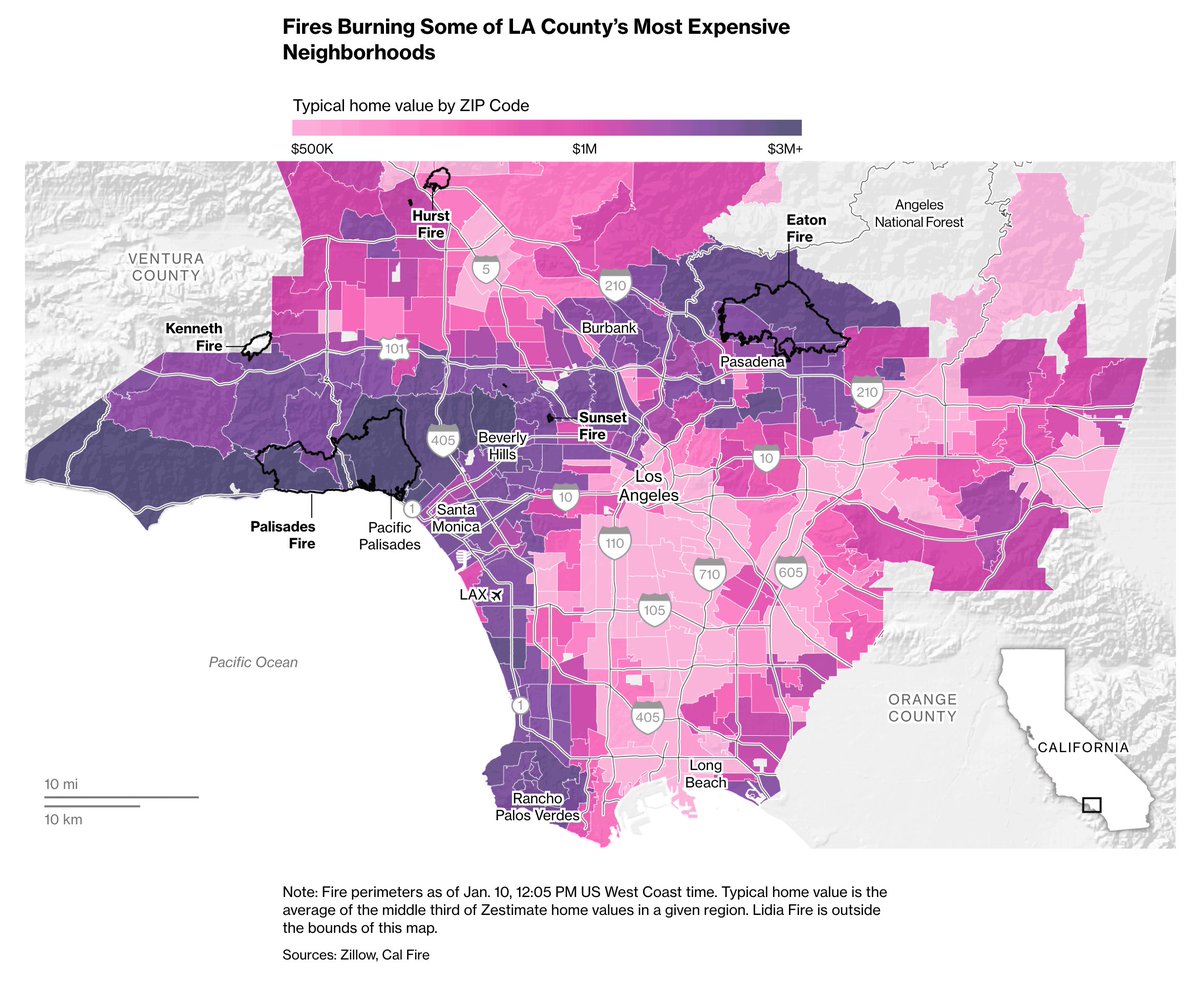
Read The Big Take: As wildfires continue to rage around Los Angeles, the climate disaster threatens to forever alter home insurance.
🔗: https://t.co/f1kqz4T6wv
Working on the interface of the tool to help people build bespoke visuals!
The goal: simple, intuitive, and powerful.
Can’t wait to share more.
Follow allong as I build it! 🚀
#DataVisualization#dataviz#Analytics#customvisual
🔟 Choosing the right chart type enhances your storytelling and ensures your data’s message is clear.
Start with the purpose, then pick the chart that best fits your goal.
Which chart type do you use most often? Let’s chat in the replies! 🚀
Chart types: how to choose the right one 📊
Data viz helps compare, spot trends, and tell stories.
The right chart depends on:
1️⃣ Your data
2️⃣ Your message
Let’s dive into chart types and their best use cases! 🧵
#DataVisualization#dataviz#Analytics#customvisual
9️⃣ Relationship
Visualize how items relate to one another.
📌 Use cases:
- Connections in a professional network
- Keyword relationships in SEO analysis
- Dependencies in a software project
🤝 Examples: Network charts, Venn diagrams, chord charts, sunbursts.