The following are my issues with this quantitative research paper:
The author explicitly says the historical universe consists of today's S&P 500 constituents, taken backward through history.
That means the strategy knows, indirectly, which companies survived long enough to still be important companies later.
Companies that failed, deteriorated badly, were acquired, or disappeared from the index are omitted.
The author actually acknowledges that survivorship bias may inflate performance by 20 –30%.
For me this is particularly problematic because the system trades cross-sectional rankings and shorts stocks.
,A proper replication needs:
point-in-time S&P 500 membership.
No compromise there.
2. The "20 years OOS" description is misleading
The paper uses data covering roughly 20 years.
But the actual OOS test consists of only three test windows:
2010–2011
2015–2016
2020–2021
Each follows a five-year training period.
There are enormous holes between its OOS periods.
The headline "20 years" therefore greatly overstates the amount of actual unseen test history.
There are only about three claimed OOS years being concatenated.
For a result as extraordinary as Sharpe 13, that is nowhere near enough for me.
3. I found a serious arithmetic inconsistency
This is the biggest red flag I found.
The paper reports OOS returns of:
Window Return
1 +206.7%
2 +207.2%
3 +62.0%
Start with $1 million.
After Window 1:
1.0 × 3.067 = 3.067M
Correct.
After Window 2:
3.067 × 3.072 ≈ 9.42M
Also essentially matches the paper.
Also essentially matches the paper.
9.415M × 1.62 ≈ 15.26M
Yet the paper says:
$110.376M
and reports a wealth multiple of 110.4×.
That cannot simultaneously be true.
For $9.415 million to become $110.376 million during the third OOS period would require approximately:
+1,072%
not:
+62%
And compounding the three reported returns gives approximately:
15.26×
or about:
+1,426%
not +10,938%.
That's not a rounding error.
Something in the reported performance tables is internally inconsistent by a very large amount.
Until the underlying daily return series reproduces the tables independently, I would consider the headline performance unverified.
4. There is an execution-timing problem that needs to be resolved
This one is potentially even more important than survivorship bias.
The paper says it uses daily data, calculates signals near the close, and participates in the same day's market-on-close auction.
But several signals depend upon price and trailing returns.
A proper backtest must establish exactly this:
Signal t → Return t+1
or otherwise prove the price used to calculate the signal was genuinely available before the execution price.
Using today's closing price to compute today's signal and then pretending you traded at today's closing price would introduce look-ahead/execution leakage.
The paper doesn't document this alignment clearly enough for me to certify it.
Given a Sharpe of 13, I would treat this as a mandatory audit item.
5. Its "value" factor bothers me
Again:
Value = SharePrice isn't economic valuation.
A company with:
$20 shares and 10 billion shares outstanding
isn't inherently cheaper than a company with:
$200 shares and 1 billion shares outstanding.
Stock splits can alter nominal prices without changing the economic value of the company.
So I would want to understand why this apparently trivial nominal-price variable produces such enormous predictive power.
Whenever a strange variable suddenly generates Sharpe ratios in the teens, my first reaction as a quant trader isn't:
"Amazing discovery."
It's:
Find the data artifact.
this paper is f*cking insane
a quant paper discovered a 13+ Sharpe out-of-sample factor by conditioning on market regimes
the result: 158.6% annualized returns with 12.0% volatility and -11.9% max drawdown across 20 years of S&P 500 data
the crazy part is the factor only appears during specific drift regimes instead of working all the time
most factor models search for what works
this one searches for when it works
bookmark before this thread gets buried
this paper is f*cking insane
a quant paper discovered a 13+ Sharpe out-of-sample factor by conditioning on market regimes
the result: 158.6% annualized returns with 12.0% volatility and -11.9% max drawdown across 20 years of S&P 500 data
the crazy part is the factor only appears during specific drift regimes instead of working all the time
most factor models search for what works
this one searches for when it works
bookmark before this thread gets buried
The next bear market won’t ask if you’re ready. Your portfolio will answer for you.
If the answer is no, don’t be that guy.
We use volatility to flip the script—turning market chaos into opportunity and rewiring risk to work in our favor.
$SPY $SSO $QQQ $QLD $VIX $SVXY $SVIX $UVXY $TQQQ #volatility $VXX
$QYLD 11%+ yield looks seductive—until you see how much upside it sells away.
Its 100% at-the-money call structure is why it hasn’t recovered from 2022.
Stop chasing headline yield. Choose a smarter design—volatility targeting with $QQQ or $QLD. It beats them all.
FREE $VIX cheat sheet.
See exactly how the “Fear Gauge” is calculated—and learn how to calculate it yourself.
Because if you invest around volatility, you should know what’s actually under the hood.
https://t.co/u2ptskpHYO
$SPY $SSO $QQQ $QLD $VIX $SVXY $SVIX $UVXY $TQQQ #volatility $VXX
$VIXM and $VXZ aren’t obscure volatility tickers. Used correctly, they can mean the difference between getting crushed in the next market meltdown and turning it into an opportunity.
👉 Real trade signals: Entry Aug 2nd | Exit Aug 5 2024
Most investors won’t learn how they work until it’s too late. We already use them.
$SPY $SSO $QQQ $QLD $VIX $SVXY $SVIX $UVXY $TQQQ #volatility $VXX
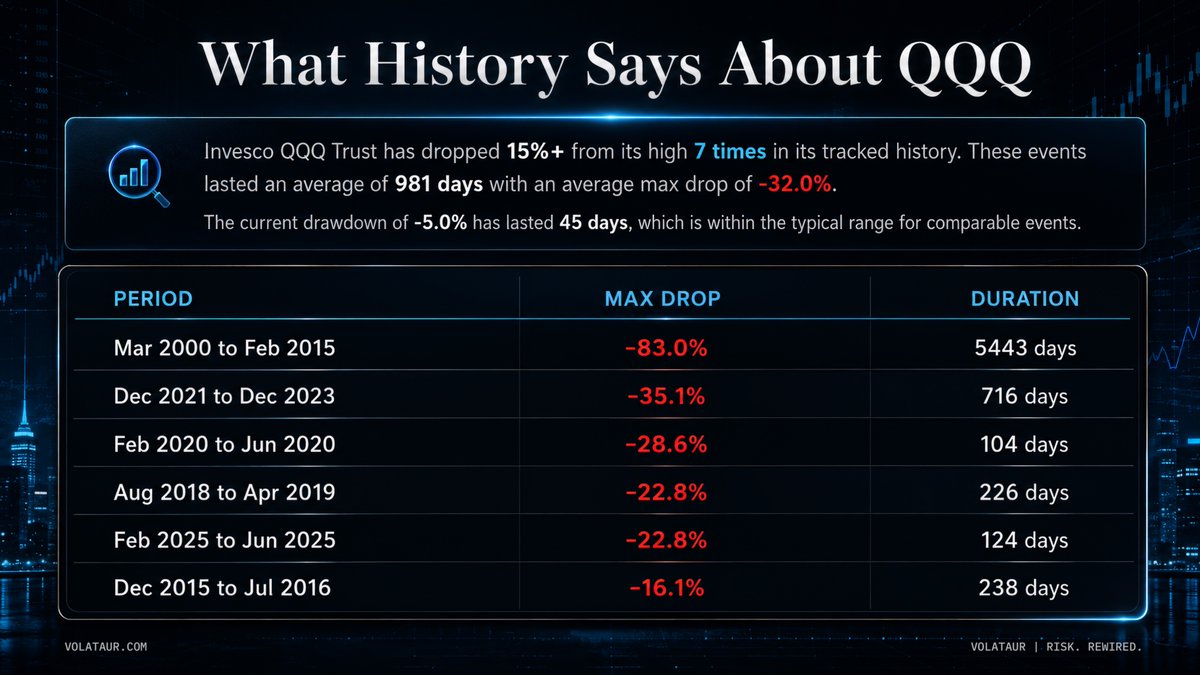
After the 2000 market top, $QQQ lost over 80%.
Don’t be the investor who finds out too late what “risk management” actually means.
Have a plan before the next real meltdown hits.
It’s not if.
It’s when.
I think this historic bull run has another 2.5 to 3 years left.
I traded through the dot-com bubble. Wild run. Big lessons.
This doesn’t feel like a top yet. But nobody knows.
That’s why I follow a system designed to manage risk and take advantage when markets break. What’s your plan?
$SPY $SSO $QQQ $QLD $VIX $SVXY $SVIX $UVXY $TQQQ #volatility $VXX
Some “live” trade signal records are really hypothetical performance dressed up with clever wording.
That matters before you pay for access.
I break down what to look for, why benchmarks get gamed, and the question every subscriber should ask first.
https://t.co/GRhLYrDYnF
$SPY $SSO $QQQ $QLD $VIX $SVXY $SVIX $UVXY $TQQQ #volatility $VXX
Only 5% of U.S. adults can ace this 8-question financial literacy test.
The average score is 3.7 out of 8.
That’s not confidence. That’s tuition for bad money decisions.
Take the test.
Can you pass?
$SPY $SSO $QQQ $QLD $VIX $SVXY $SVIX $UVXY $TQQQ #volatility $VXX
https://t.co/dRwfWpwaqz
Buy-and-hold relies on patience. Tactical investing relies on rules.
Both can work. Both can break you.
The real test isn’t what sounds smartest in a bull market. It’s what you can actually follow when volatility gets loud, and your portfolio starts throwing elbows.
$SPY $QQQ $QLD $TQQQ $SVXY $VXX $VIX $SSO $UVXY $DIA https://t.co/Kk9RQu2k82
Panic selling starts when fear gets louder than your plan.
Volatility isn’t the problem.
Inventing rules while your portfolio is bleeding is.
Decide before the market tests you, or the market will decide for you.
$SPY $QQQ $QLD $TQQQ $SVXY $VXX $VIX $SSO $UVXY $DIA
https://t.co/yQvUA63CKV
Tired of wrecking your returns because fear keeps grabbing the wheel?
Good. This was built for you.
$SPY $QQQ $QLD $TQQQ $XIV $SVXY $VXX $VIX $SSO $UVXY https://t.co/lHt5COhe7w
$3.2M is now wagered on when the Fed hikes rates.
Not cuts. Hikes.
The market spent years obsessing over the pivot.
Now traders are pricing the sequel nobody wanted: inflation’s encore and a Fed that may not be done breaking things.
SpaceX just went public. Now $SPCX is already being added to the Nasdaq 100.
One of the fastest inclusions ever.
Turns out the market doesn’t just chase rockets.
Sometimes it straps an index fund to one.
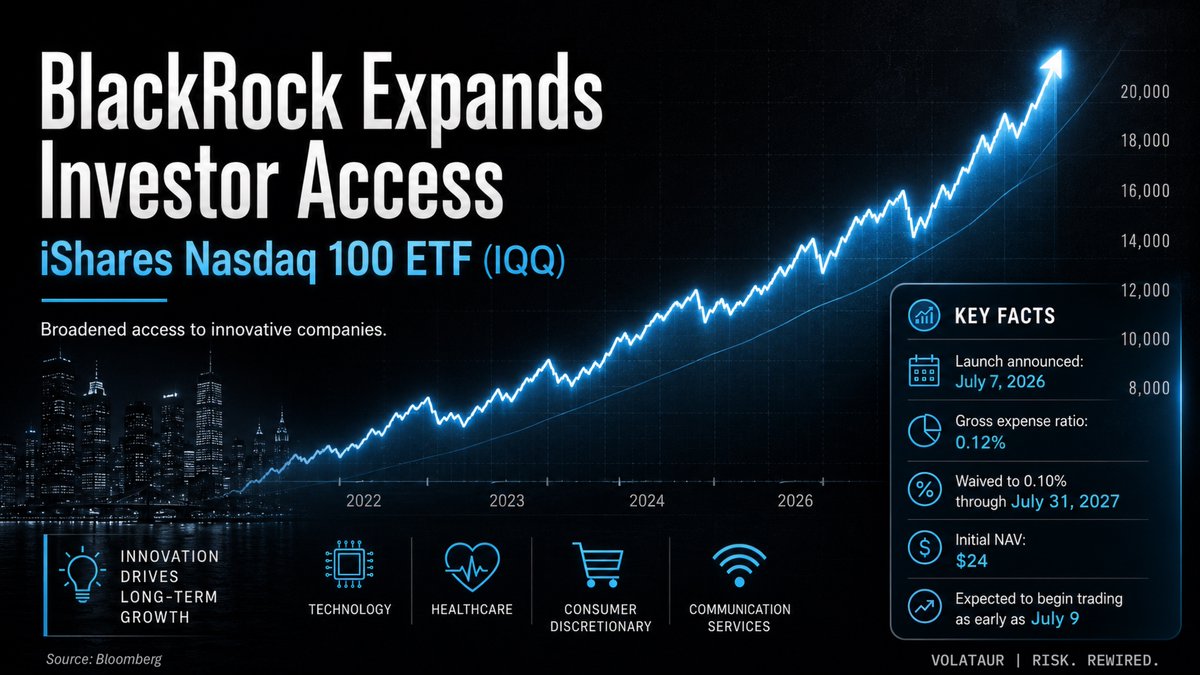
QQQ finally has real Nasdaq-100 competition.
BlackRock’s $IQQ comes in at 10 bps after waiver, State Street’s $QNDX at 10 bps, vs $QQQ at 18 and $QQQM at 15.
Same castle, cheaper keys.
The crown jewel just heard footsteps.
PSA: Potential red flag.
When “tracked from live trades sent to paying members” sits beside reported portfolio returns, ask:
Was this exact portfolio configuration live from the first date shown?
Transparency shows the changelog and separates live from hypothetical.
$SPY $SSO $QLD $VIX $VIXY $UVXY $UVIX #volatility $VXX $SDS $SQQQ $QQQ $TQQQ