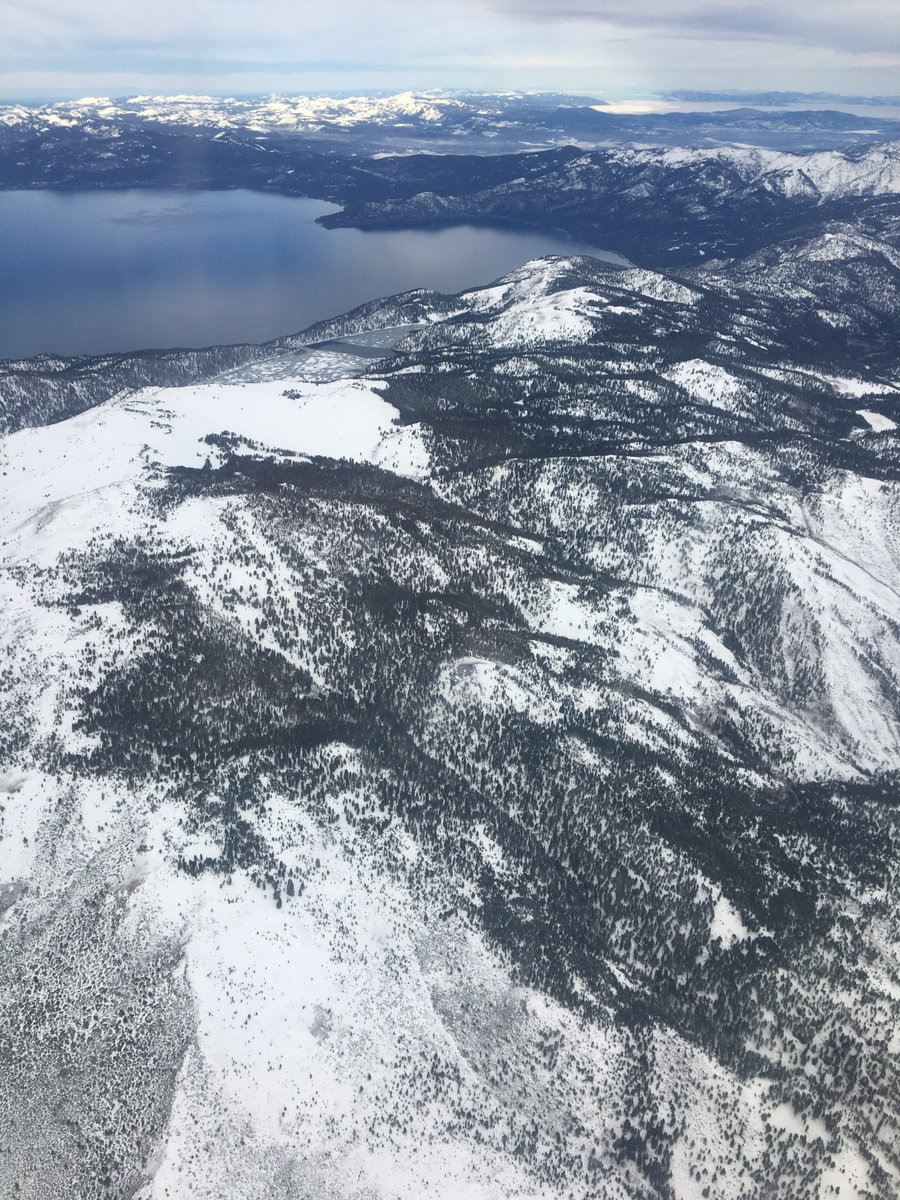
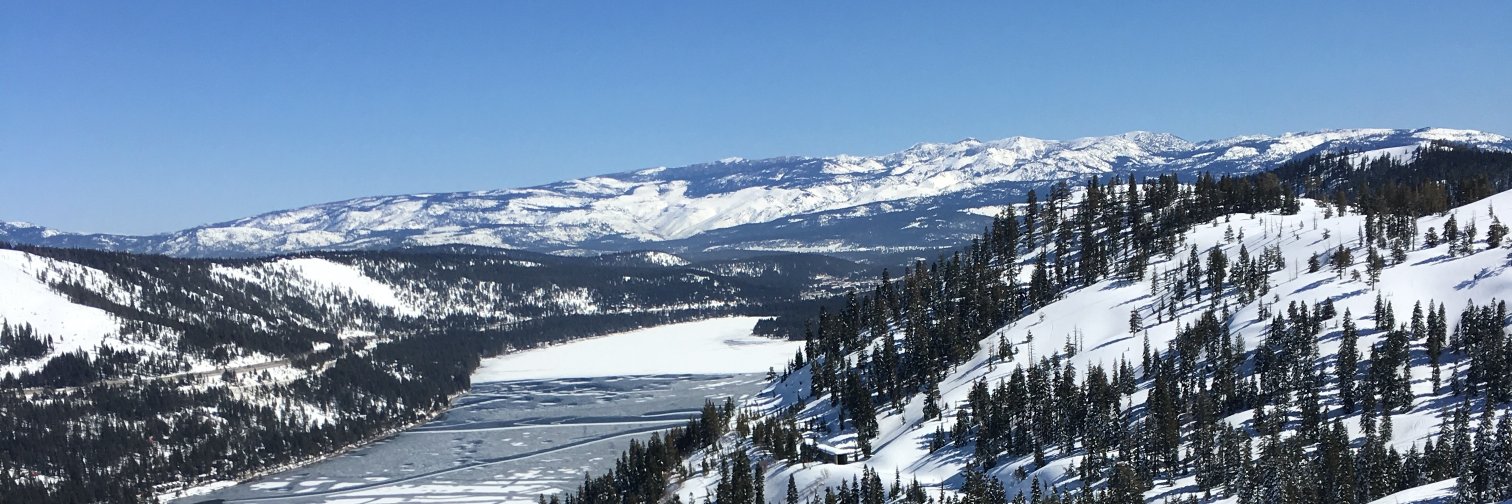
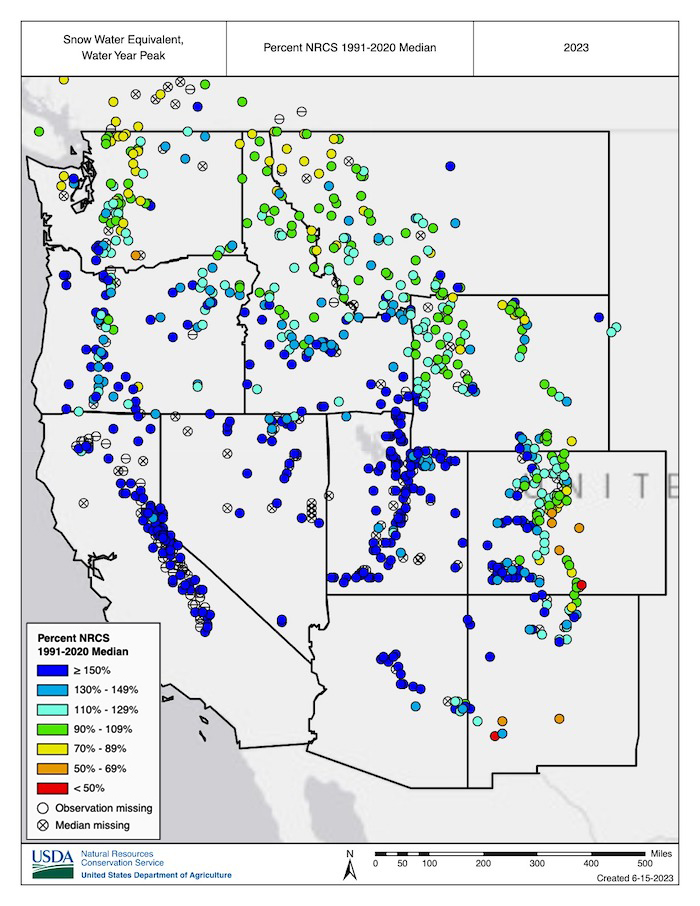
Water Year 2023 Snow Drought Conditions Summary & Impacts in the West:
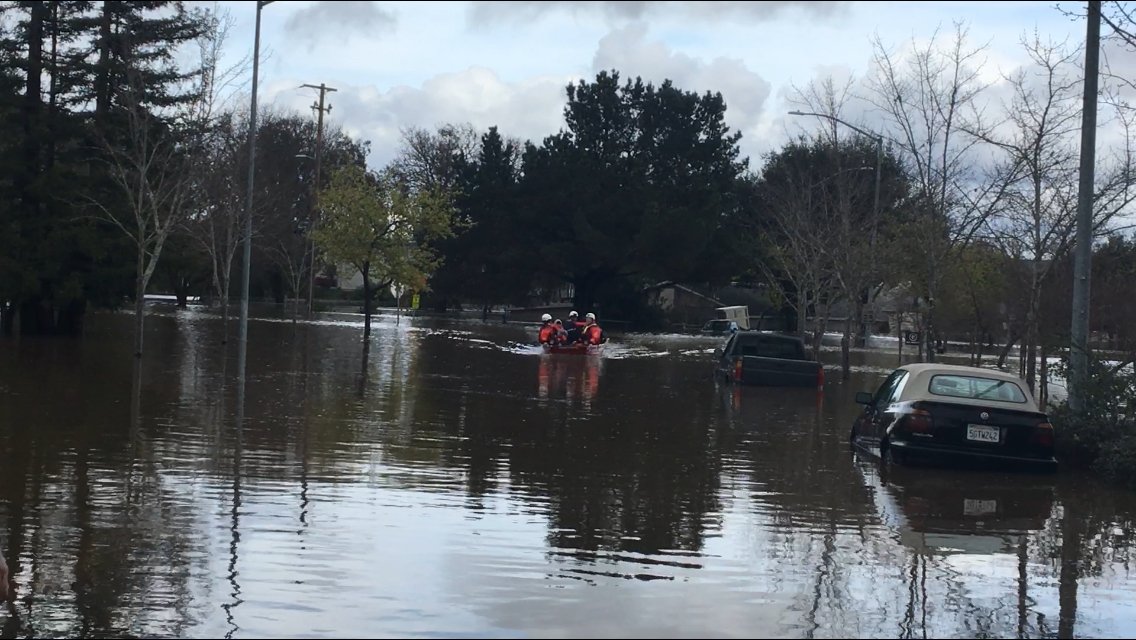
This year's snow season wiped away #drought in much of the West, except the Pacific Northwest
Read more ➡️ https://t.co/qZIphDedFE
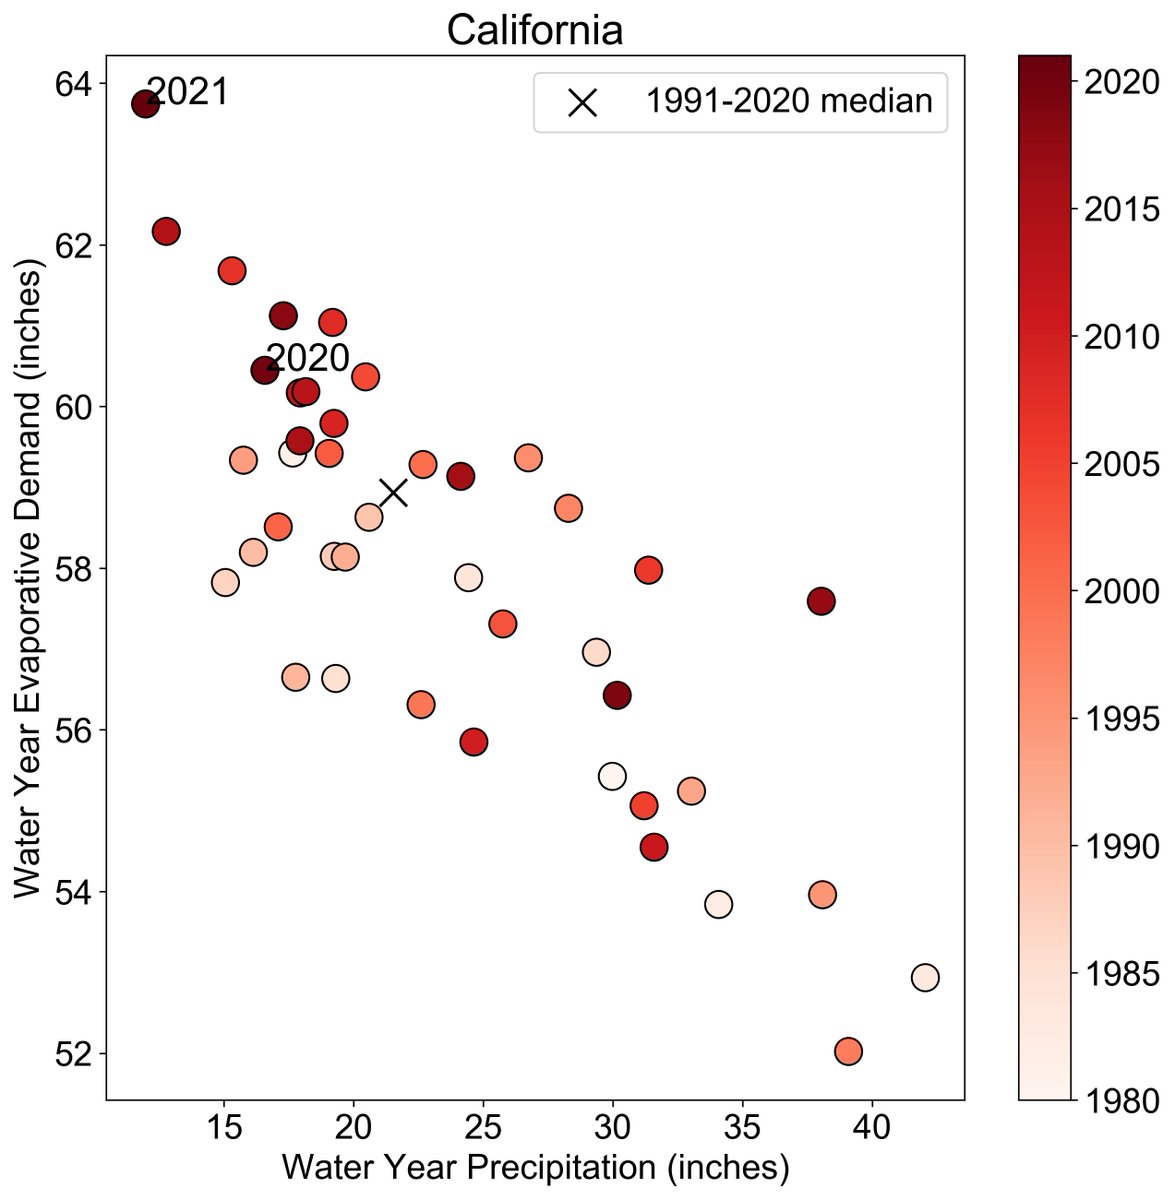
Also check out this new paper in @AMS_JHM led by @DRIScience researcher Dr. Christine Albano about trends in evaporative demand over the US and how they compare between different gridded data sets.
Enjoy!
https://t.co/I6vbUwhaq5
(2/2)
Interested in learning more about Evaporative Demand (i.e., atmospheric thirst)?
Check out this new 2-pager by @CnapRisa researchers about how it relates to drought and wildfire: https://t.co/3YRUZx48t6
(1/2)
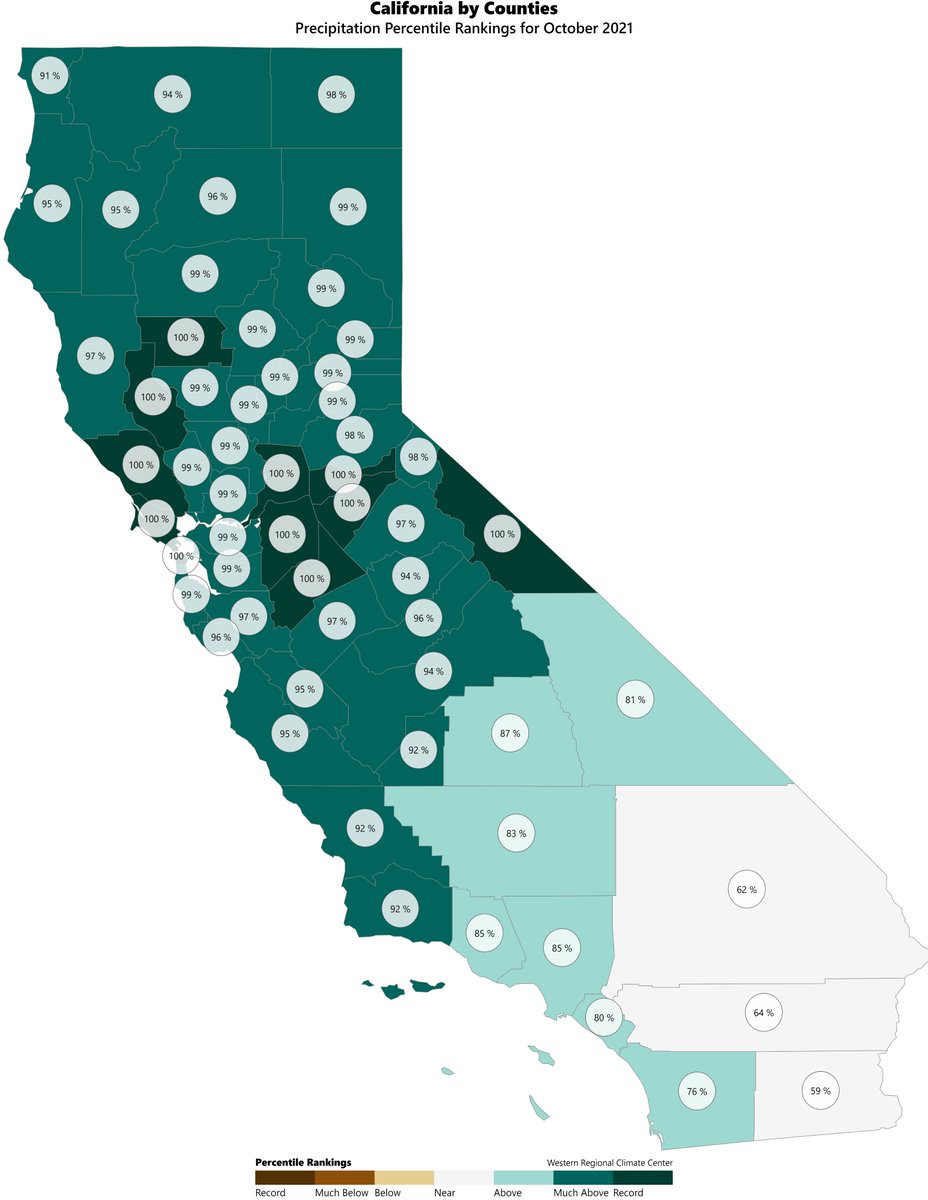
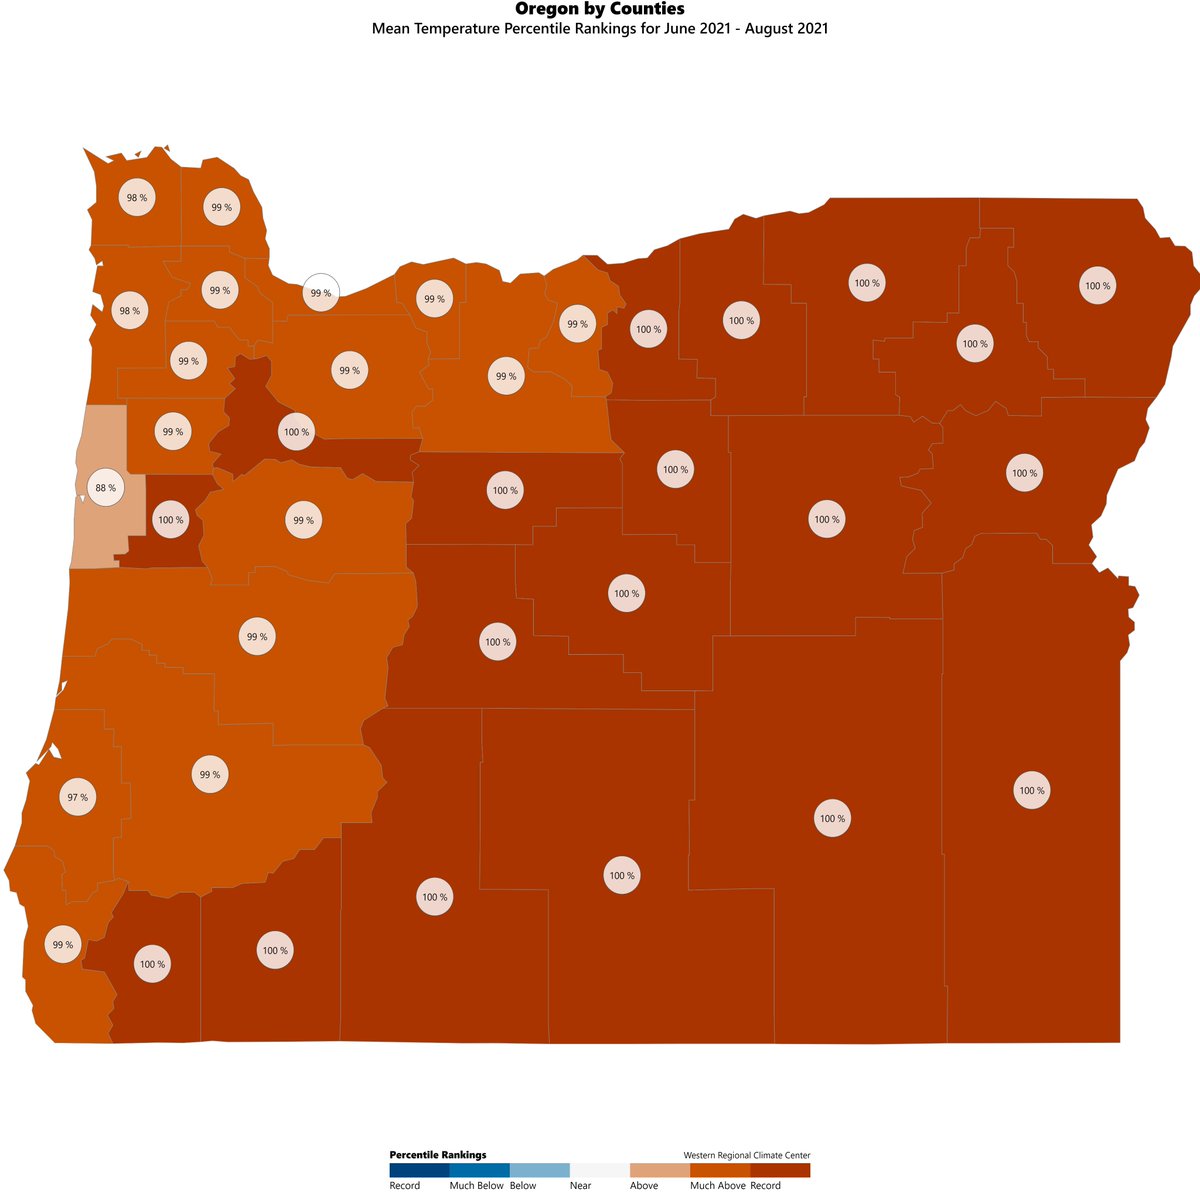
County-level maps and time series now available on our State Climate Trackers!
This tool provides choropleth maps and time series of climate summaries based on PRISM climate data for the Western states.
Check it out!
https://t.co/FFqHzWDMgJ
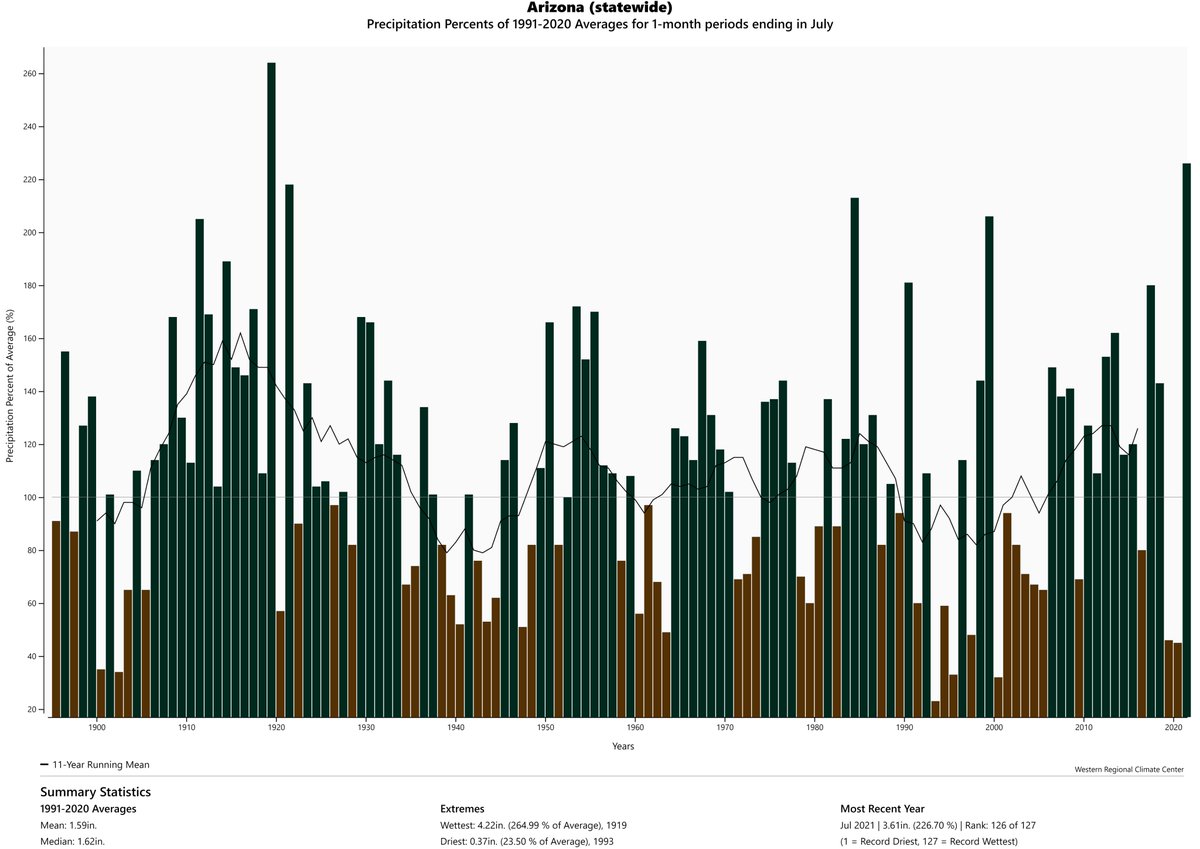
After two years in a row with a weak monsoon, July 2021 produced well above normal precipitation across Arizona. Gridded PRISM data from our state climate trackers show this July was the 2nd wettest on record statewide. 2020 and 2019 both <50% of ave.
https://t.co/68uhq0pWN9
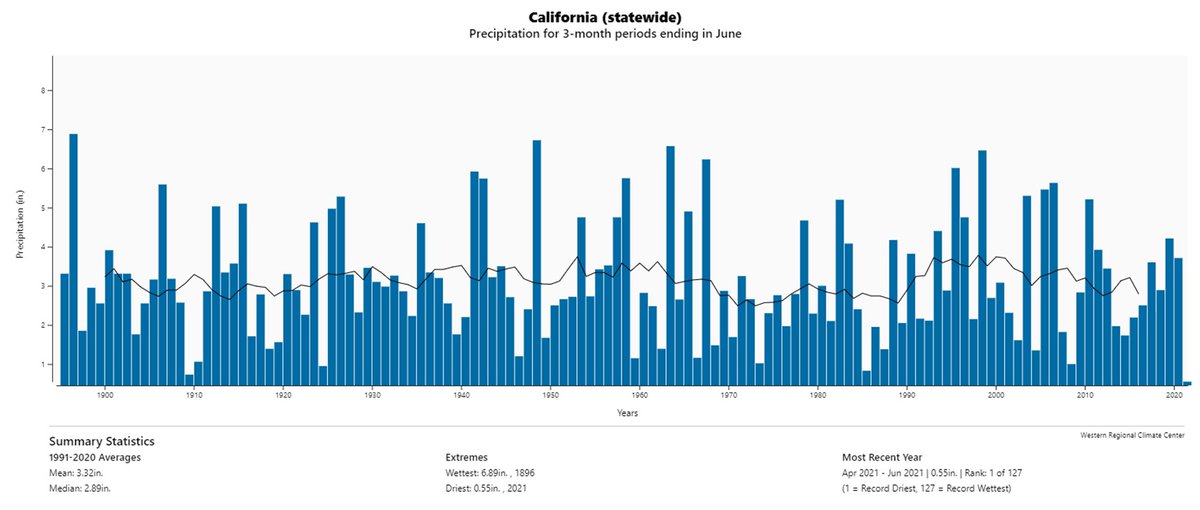
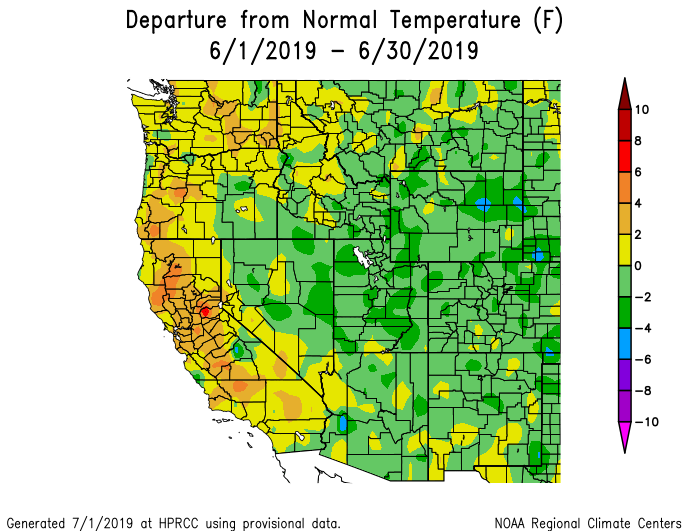
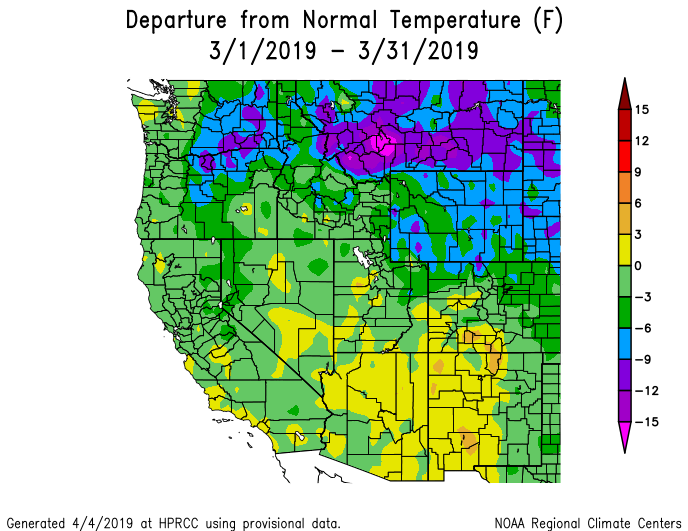
The effects of #climatechange are intensifying California's extremes. This graph shows that April, May, and June of 2021 were the warmest and driest April-May-June period since 1896. More info on #drought here: https://t.co/eHGwN9fbeo
#cawater#cadrought#saveourwater
#jobopening
The @DRIScience is receiving applications for a postdoctoral fellow in Applied and Ecological Climatology to support research, applications development, and science delivery within @WRCCclimate.
Apply here:
https://t.co/a4jSOV1CbW
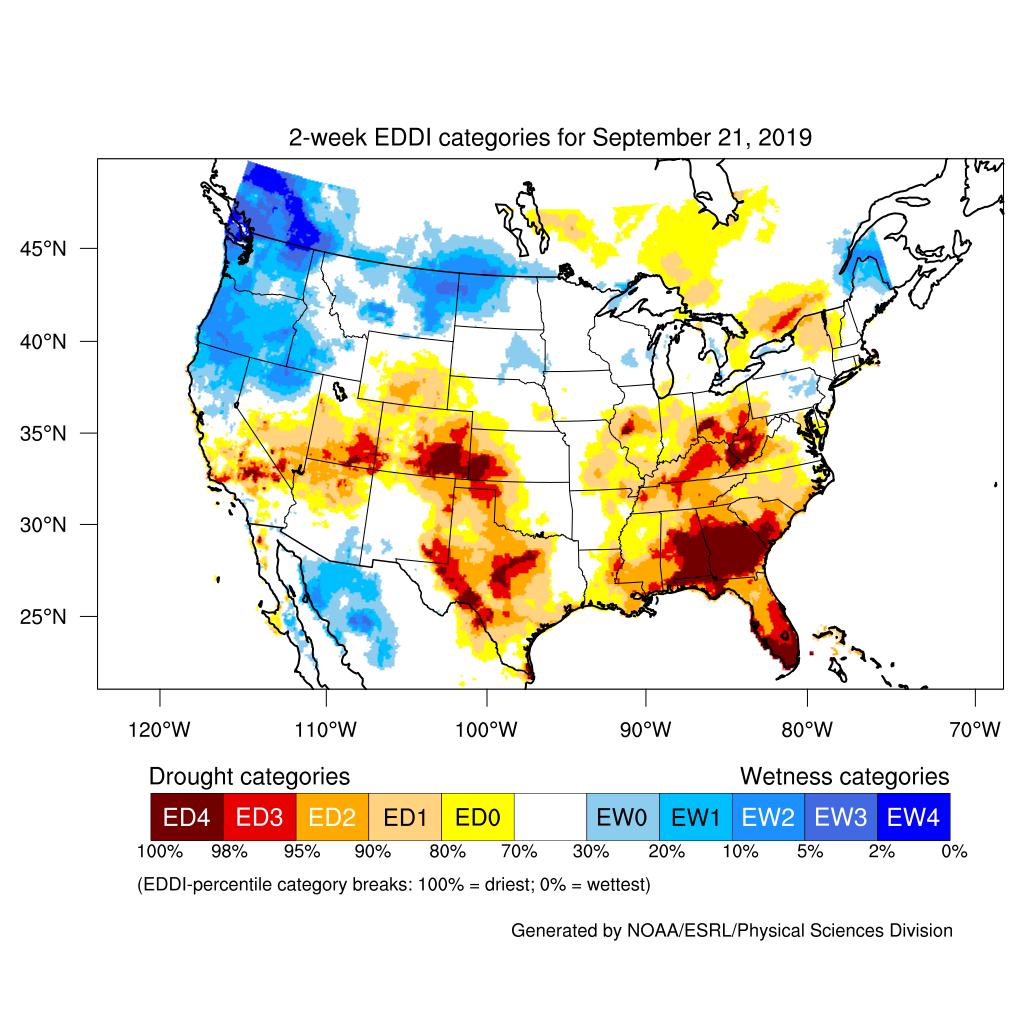
#DroughtMonitor 9/26: Rapidly intensifying “flash drought” depicted here by @NOAA’s #EDDI tool shows thirst of atmosphere over parts of FL, GA & AL since August.
S. Rockies & Four Corners also drying out.
More: https://t.co/HAvzo9A2Zr & https://t.co/YBE9JQoznR. #Drought2019
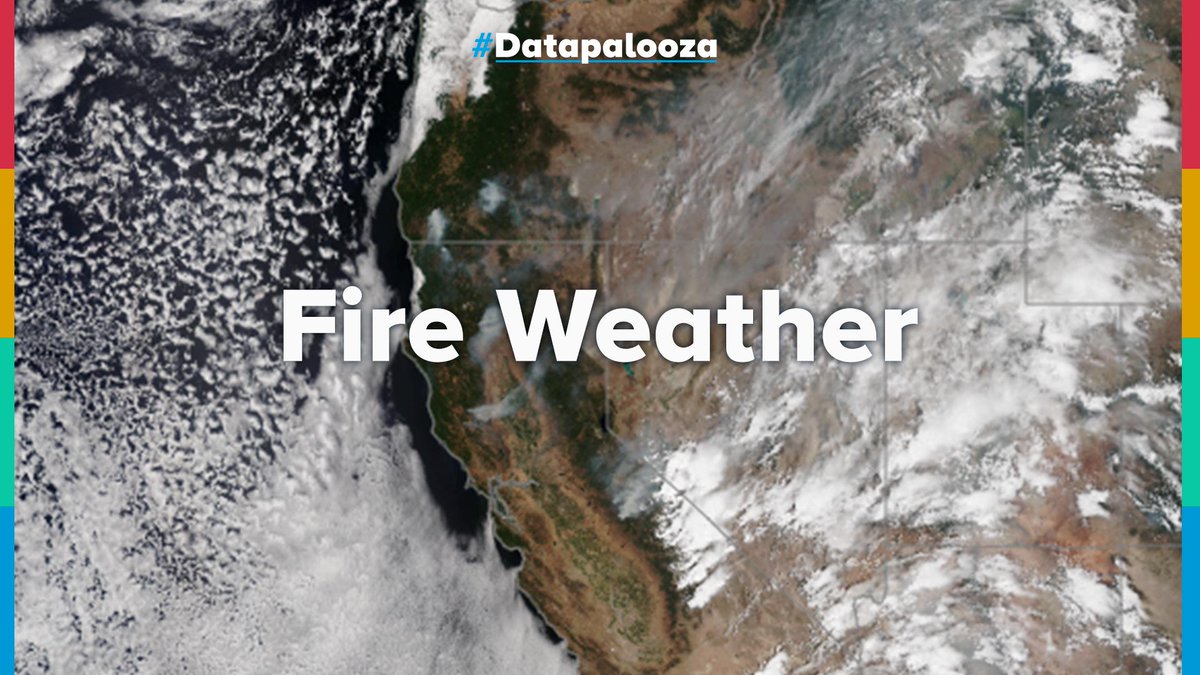
@NOAASatellites@NOAA We've partnered with fire agencies to help incorporate more drought information into fire management. NOAA's Evaporative Demand Drought Index is being used to monitor fire potential related to extended hot, dry, windy, sunny periods. #Datapalooza
https://t.co/iLT82eFBBK
We’re all fired up about the next round of today’s Twitter chat relay! 🔥
Experts will be available until 6 p.m. EDT to discuss how @NOAA data is used to study fire weather and to answer all your burning questions about it.
Reply to this tweet and use #Datapalooza!
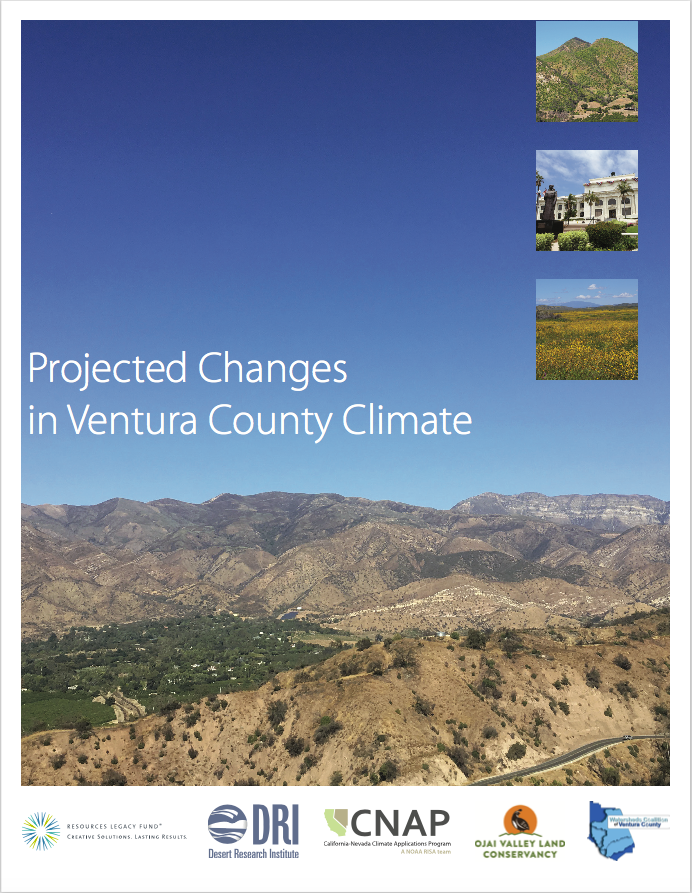
WRCC researchers worked with the Watersheds Coalition of Ventura County (CA) to produce a report on projected climate change for the County. Interested? Report available here: https://t.co/KksrvvAgGD
Very cool article on the impacts of atmospheric rivers in British Columbia featuring research on the relationship between atmospheric rivers and snow avalanches led by WRCC's Ben Hatchett.
https://t.co/06PlQITGLT
Check out the new paper looking at drought indices and fire danger in CA-NV by WRCC staff @hydromet_man, @watermapper, Tim Brown, Kristin VanderMolen and others!
Need something fun to do for a few minutes? Help us test new software by telling us about what weather event of 2018 was most memorable where you live! Link here: https://t.co/JoFqdpPc7R Results to follow in a few weeks. Please share!