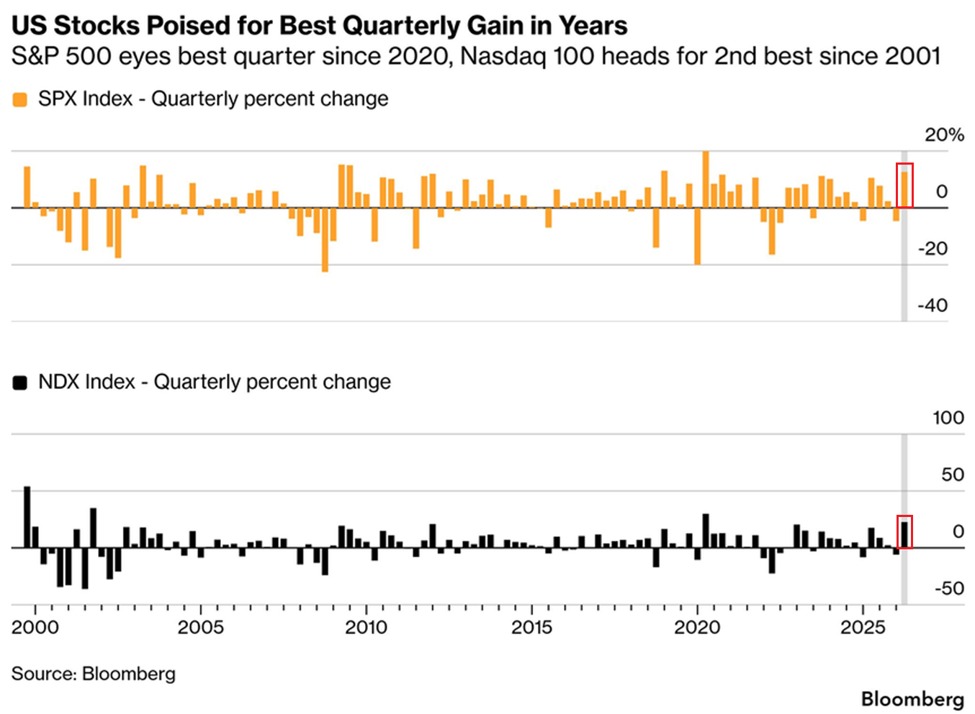
Q2 2026 has been a historic quarter:
The S&P 500 is up +14% so far this quarter, on track for its best quarterly performance since Q2 2020.
This would mark the 2nd-largest quarterly gain since the 2008 Financial Crisis recovery.
At the same time, the Nasdaq 100 is up +25%, on track for its strongest quarter in 5 years.
This would also mark the Nasdaq 100's 2nd-best quarterly performance in 25 years.
US stock gains have also fueled a global rally, with the MSCI All-Country World Index (ACWI) up +13% so far in Q2, on track for the biggest quarterly gain since Q4 2020.
The global equity rally is accelerating.
AI-related debt issuance is skyrocketing:
US corporate investment-grade gross debt issuance is projected to surge +25% YoY in 2026, to a record $2.25 trillion.
This would mark the 4th consecutive annual increase.
After accounting for maturing debt that is repaid, net new investment-grade debt issuance is projected to jump +57% YoY to a record $1 trillion.
Year-to-date, investment-grade gross issuance has already risen +20% YoY, to $796 billion.
The primary driver behind the surge is AI CapEx, with AI and AI-related debt issuance estimated to increase to at least $400 billion this year, according to Morgan Stanley.
The AI revolution is fueling a historic surge in corporate borrowing.
Employment in AI-linked sectors is contracting:
Over the last 3 months, AI-affected sectors posted an average monthly decline of -11,000 jobs.
This includes roles in management consulting, graphic design, office administration, telephone call centers, computer systems, software publishers, and web search.
Since mid-2023, there have been only 2 months with a net increase in employment in these sectors.
By comparison, at its 2022 peak, employment in these industries increased by as much as +55,000 jobs per month.
Furthermore, employers cited AI as the reason for 38,579 job cuts in May, the highest monthly total on record, according to Challenger Gray data.
This marks the 3rd consecutive monthly increase since ~5,000 in February.
The impact of AI on the labor market is becoming increasingly visible.
US housing inventory growth is accelerating:
The monthly supply of new single-family homes rose +1.0 month in May, to 10.3 months, the highest since February 2009.
This indicator measures how many months it would take to sell all homes currently on the market at the current pace of sales.
The higher the reading, the weaker the demand relative to supply.
By comparison, the long-term median for this metric is ~6.0 months.
Since the 1970s, 6 of the 7 times this indicator surged to current levels, the US economy was already in a recession.
This comes as elevated mortgage rates and record homeownership costs are keeping buyers on the sidelines, leaving builders with growing inventories that they are struggling to clear.
The US housing market has rarely been this oversupplied.
BREAKING: Super Micro Computer stock, $SMCI, falls over -9% on the day on news that the company's office has been raided as Taiwan expands its "chip smuggling" probe.
Worldwide supply chain pressures are rising:
The Global Supply Chain Pressure Index is up to 1.8 points, the highest since July 2022.
This index measures how difficult it is for companies to move goods around the world, with positive readings signaling worsening disruptions.
The index jumped +1.1 points in April, marking the biggest monthly increase since March 2020.
This surge was driven by the Iran War, amid the closure of the Strait of Hormuz.
The longer these disruptions persist, the worse delivery delays and price pressures across the global economy will become.
Global trade is facing a historic disruption.
The cost of leveraged equity positions is surging:
The implied 3-month S&P 500 financing cost is up to ~110 basis points, the highest since December 2024.
This metric measures how expensive it is for investors to hold leveraged US equity positions, with higher readings indicating tighter financial conditions in equity markets.
Implied financing costs have doubled over the last 2 months.
This comes as surging demand for leveraged exposure through leveraged ETF inflows and elevated futures positioning has driven an unusual mid-year spike.
Rising financing costs are directly increasing the burden of holding leveraged positions, and when those costs become too high, forced deleveraging can accelerate market volatility.
Market leverage is becoming dangerously expensive.
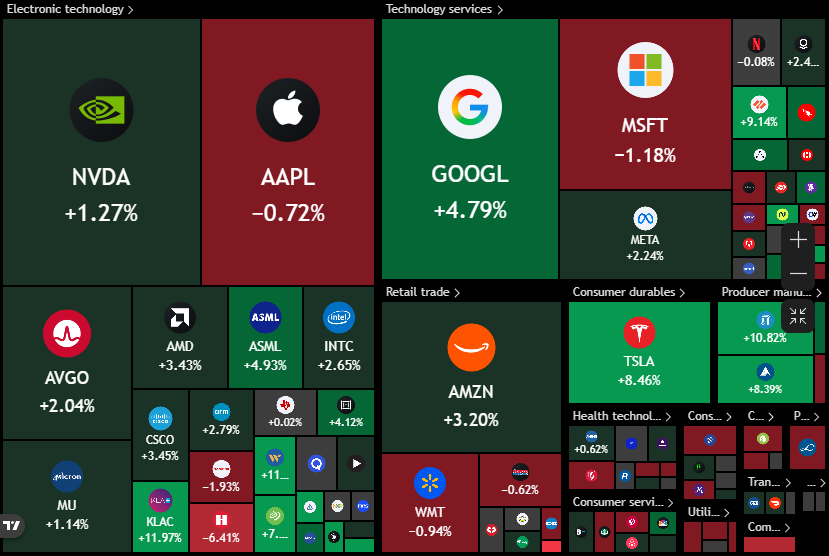
BREAKING: Hedge funds sold the most US information technology equities in the week ending June 25th since data began in 2016, according to Goldman Sachs.
This even exceeds August 2024, when the Nasdaq 100 fell over -10%, entering correction territory.
In total, hedge funds sold the most US equities since the April 2025 "Liberation Day" selloff.
Meanwhile, Magnificent 7 stocks' exposure as a % of total US hedge fund exposure is down to 14.5%, near the lowest in 3 years.
This percentage has declined -7 percentage points since the start of 2026, marking the biggest 6-month decline since the 2022 bear market.
Hedge funds are cutting US tech exposure.
Levered crypto plays are getting crushed:
The 2x leveraged long MicroStrategy ETFs, $MSTX, and $MSTU, are both down -82% year-to-date, trading at their lowest levels since their 2024 debuts.
At the same time, the 2x leveraged long MicroStrategy ETF, $MSTP, is down -81%, also at its lowest since its June 2025 launch.
This comes as MicroStrategy, $MSTR, has dropped -46% year-to-date, down to its lowest level since February 2024.
Last week alone, $MSTX, $MSTU, and $MSTP nearly halved in value, as $MSTR declined -27%.
Meanwhile, both long and short leveraged ETFs tied to MicroStrategy that launched in 2024 are down more than -90% since inception, even as billions of dollars have flowed into the funds.
Leverage is magnifying losses across the crypto market.
China’s is seeing unprecedented money supply growth:
China's M2 money supply is up to a record ~240% of GDP, the highest among any major economy in the world.
This metric has surged +100 percentage points since the 2008 Financial Crisis.
Over this period, China’s M2 money supply has surged +500% in Dollar terms.
By comparison, the country's gold reserves and total FX reserves have risen +100% and +60%, respectively.
To put this into perspective, Japan's M2-to-GDP ratio, the next highest, stands at ~185%, while the US sits at ~70%.
China's monetary expansion is unlike anything seen among major economies.
BREAKING: The US and Iran have agreed to halt strikes and meet this week, per Axios.
The announcement comes just one hour before US stock market futures are set to reopen.
US households are "fighting" inflation with debt:
Total consumer credit surged +$25 billion in March, to a record $5.14 trillion.
This marks the largest monthly increase since March 2025.
Revolving credit, which includes credit cards, jumped +$10 billion, to $1.34 trillion, the highest since November 2024.
This was also the biggest monthly increase since February 2024.
Non-revolving credit, mainly auto and student loans, rose +$15 billion, to a record $3.80 trillion.
As a result, total consumer credit has now surged +$1.05 trillion since the 2020 pandemic.
US consumers' debt levels are skyrocketing.
AI is reshaping how institutional investors work:
~52% of institutional investors now primarily use AI for research, according to a Barclays survey of 410 fixed-income investors.
This is followed by hedge funds, at ~44%, which primarily use AI to process and analyze large volumes of market data.
By comparison, ~27% of hedge funds use AI for modelling and risk analysis, versus ~22% of long-only managers and ~17% of asset owners.
Operations, compliance and reporting, and investment decisions each account for just 10% to 15% across these groups.
AI is changing how investment decisions are made.