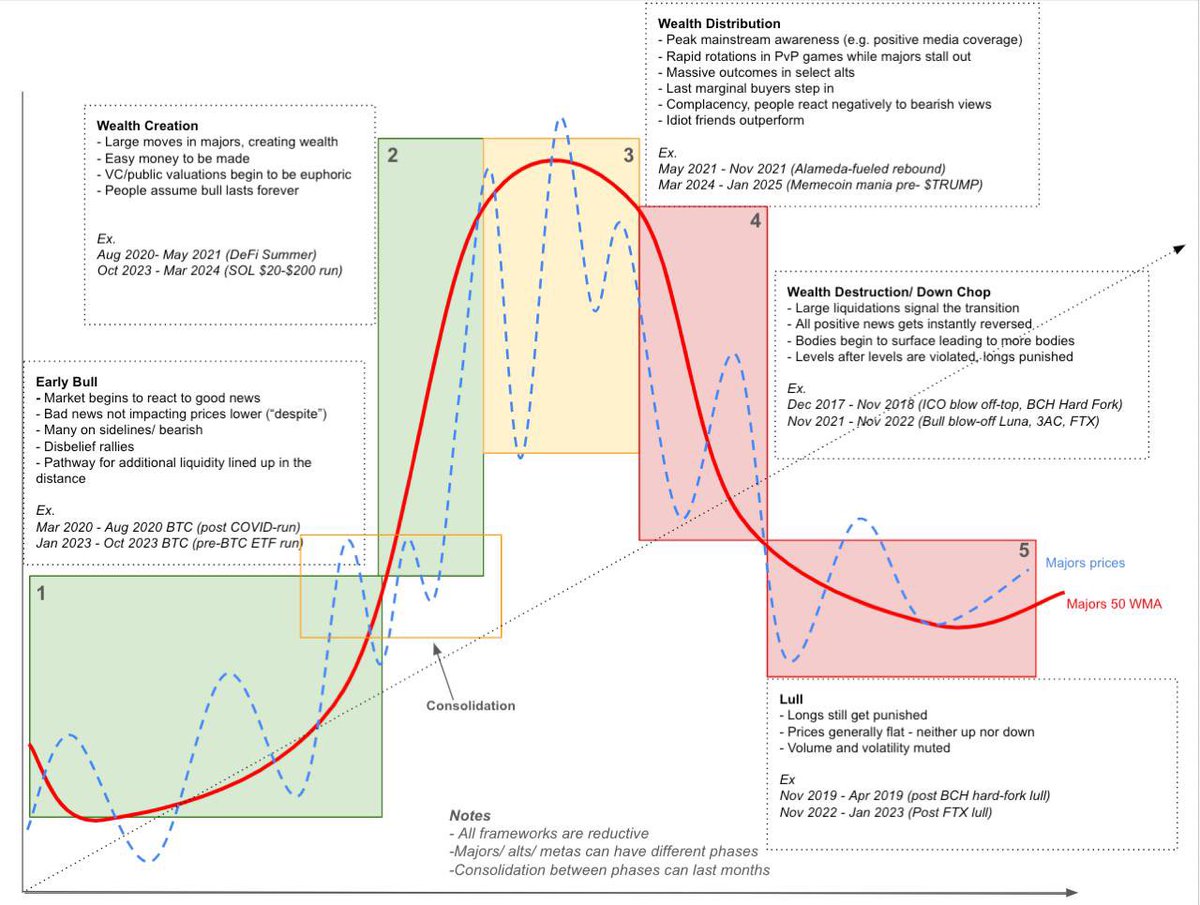
Since some of you found this framework helpful, here’s an updated version
All frameworks are by definition reductive but this gives me clarity on navigating time frames and is part of the reason I limited significant drawdowns to 2 (2017 end and May 2021) in the past 7 years in a +100% vol asset class
Thoughtful critiques welcome
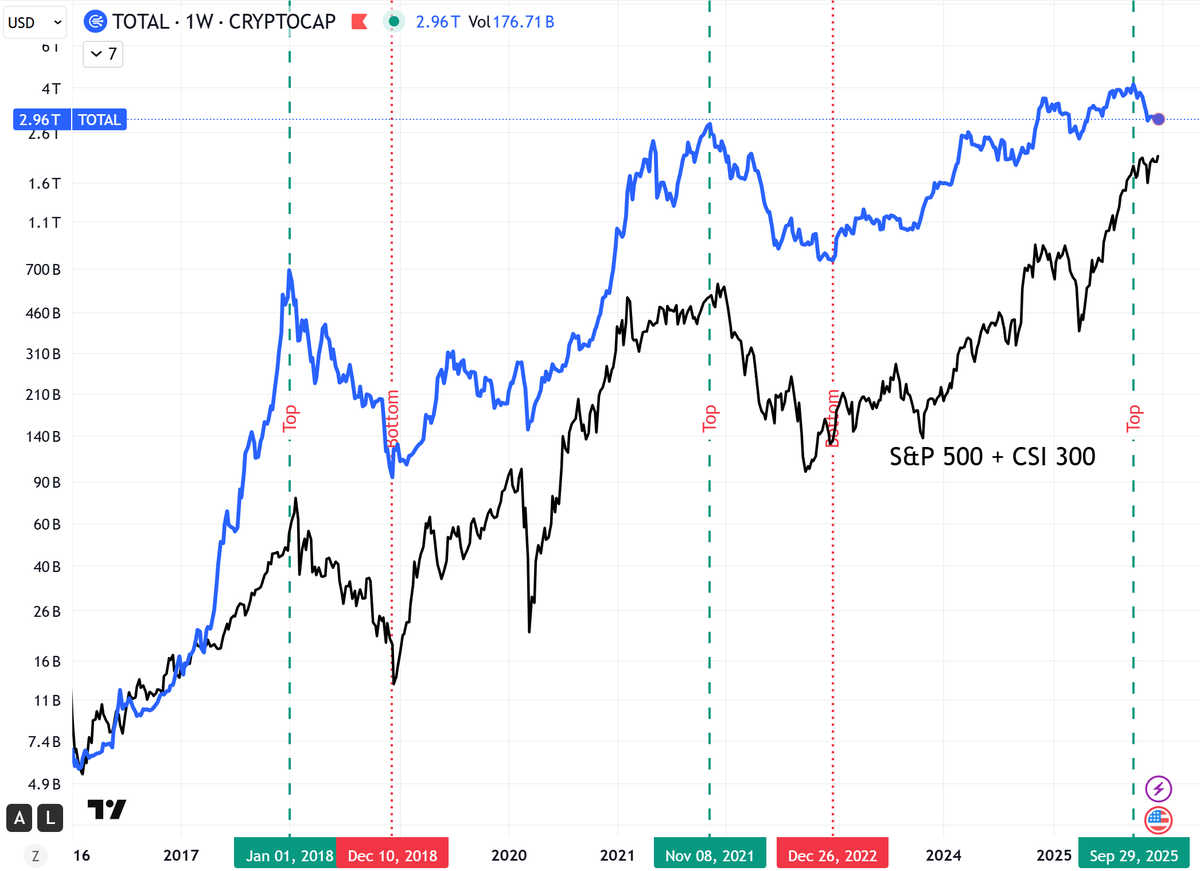
Crypto market is highly correlated with China and the US stock markets combined over the past decade as is shown in the picture (TOTAL VS S&P 500 + CSI 300, weight 1:0.8).
When China and the US stocks go up, cryptos will possibly follow the trend.
@that1618guy their correlation will remain weak as long as the logic behind their diversion over the past month remains effective.
could you please explain why the crypto market diverted from stocks?
Liquidity, Volatility and the Slow Grind Higher: Crypto’s October 10 Reset
After one of the most violent liquidation events of the year, the crypto market is recalibrating. Liquidity has shifted, leverage has been flushed, and the macro backdrop is once again steering the ship. The next leg most likely won’t be a euphoric V-shaped rebound, but a slow and deliberate rebuild as capital, confidence, and positioning reset before leading into a heated rally into the back half of Q4.
Heading into the rest of October, the question isn’t whether crypto survives the shock, but rather, it’s how crypto will rebuild under tightening liquidity and rising selectivity. The following breakdown walks through the key macro signals, where BTC and ETH likely stabilize and what conditions need to align for a sustainable recovery.
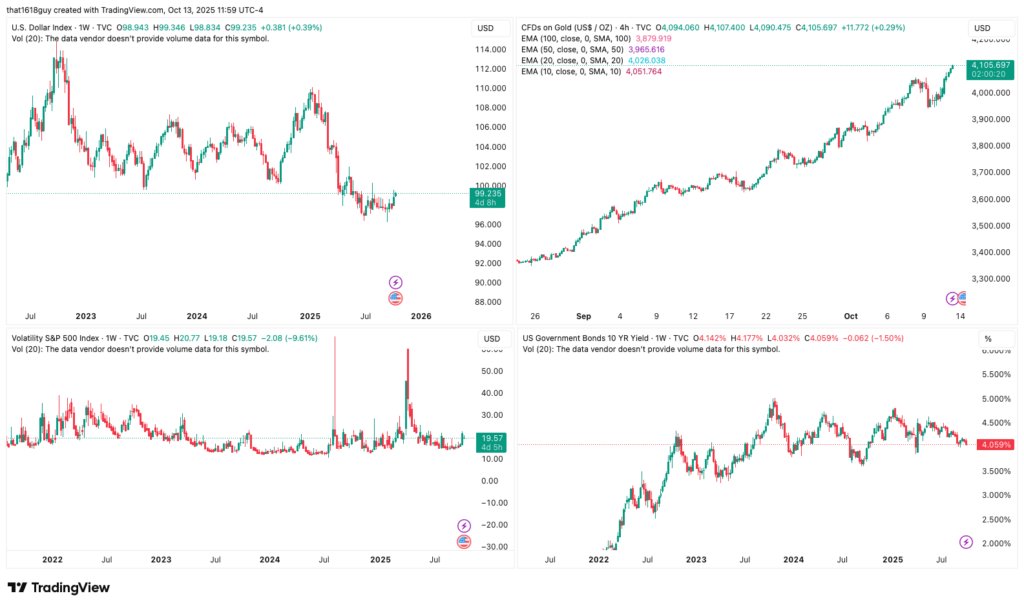
I break down the 4 macro charts that I am tracking and what it is telling us, more below.
DXY - The Dollar’s Comeback (Top left chart)
The dollar has been climbing since the September rate cut and is now pushing into the 100 area, which should act as resistance. Why did cuts lift DXY? Cuts lower front-end yields, but FX trades on relative stance, growth differentials and hedging demand. The Fed cut into a world where the ECB and BoE were either already easing or more constrained.
As the dollar approaches the 100 resistance level, this area will be one to really pay attention to. A clean break above would be a headwind for beta assets, while a rejection here would give equities and crypto some breathing room. If DXY manages to break and hold above 100, it should serve as an early signal of market stress; a sign that growth expectations are slipping and global capital is rotating back into safety
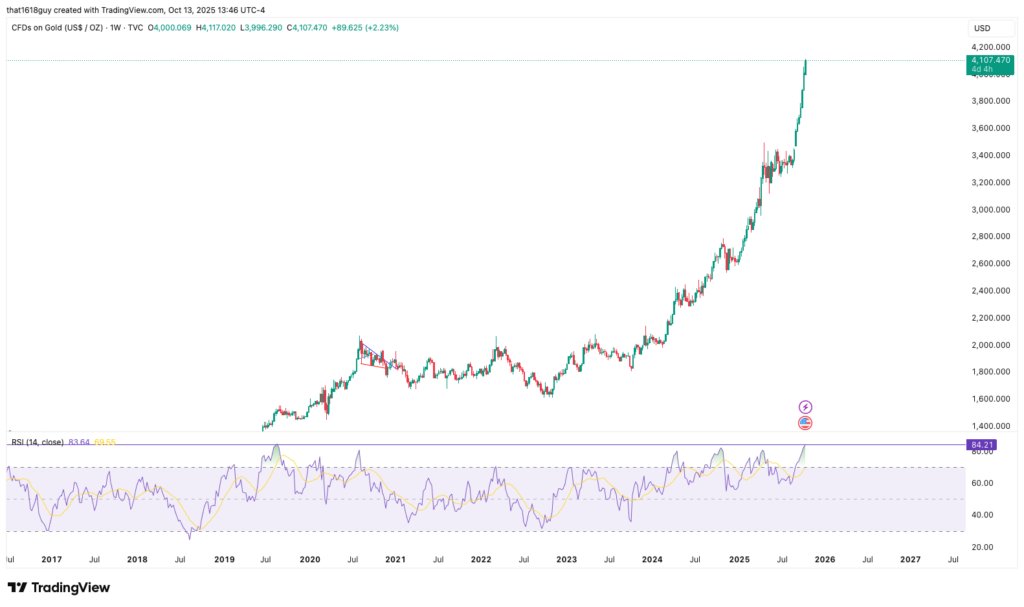
Gold - Relentless Strength (Top right chart)
Gold has broken above 4,100 and is holding firm. This is the “liquidity plus uncertainty” trade: central-bank buying, easing real yields and persistent demand for hard assets. The trend remains powerful at the moment, with only shallow corrections so far and no real signs of a top.
Gold’s weekly RSI has surged to 84.2, one of its highest readings in recent history. Historically, this zone tends to precede consolidation or mild pullbacks, as momentum cools and positioning resets. Still, in strong macro-driven rallies like the current one RSI can stay elevated for longer so being overbought doesn’t necessarily mean the run is over.
For crypto bulls, the best-case near-term scenario is a temporary pause in gold’s advance. A breather in the defensive bid for gold could free up liquidity and risk appetite to rotate into higher-beta assets like Bitcoin, especially as volatility normalizes post-liquidation.
VIX - Quiet Warning (Bottom left chart)
The VIX started climbing before last week’s market drop. Why was volatility rising while the S&P and Nasdaq were still hitting new highs? Three likely reasons:
Dealer positioning and waning call gamma reduced the usual volatility dampening
Traders started hedging ahead of trade headlines and earnings season
Seasonal patterns as we come into September and October which are historically more volatile
When the VIX starts climbing before the market rolls, it’s usually the tape telling us positioning is stretched. For now, the VIX has rejected off the 20 level and has pulled back towards 19. I’ll be watching this closely over the next few weeks. What we will want to see is the VIX to pull back towards the low teens and stabilize there.
U.S. 10-year - Controlled Descent (Bottom right chart)
The 10-year is still north of 4% but has been drifting lower since the September cut. What that says is that short term premium is contained and the market is leaning to more easing into Q4. Into October and year-end, i see two paths:
> Orderly disinflation: 10-year drifts toward 3.8–3.9. Duration relief supports equities and crypto multiples.
> Growth scare: 10-year drops faster, curve steepens bullishly but equities sell on earnings risk and bid for safety.
Imo the slope of the move matters more than the level. We ideally will want to see a slow grind lower which should help risk overall. So far what we are seeing here is good for the market.
What This Means for BTC
My base case is that BTC establishes a range between roughly $108K and $124K while market makers and funds rebuild capital and assess the damage. I remain short-term neutral and medium-term bullish.
So far, the rebound off the lows has been solid, but the $117-115K area is a key inflection point, roughly the midpoint of the range and where prior liquidity sits. A rejection there wouldn’t surprise me. I’ll start leaning more bullish if BTC can close and sustain above $118-119K on higher timeframes. That would signal real strength returning and shift my short-term bias to bullish.
On the downside, a retest or liquidity sweep of the $108-110K zone remains possible, especially if we see renewed U.S.–China trade tensions or risk-off macro shifts. As a reminder from the macro setup:
> If DXY stalls below 100, 10-year yields drift toward 3.9% and VIX stays under 20, that backdrop supports a steady grind higher.
> If DXY breaks above 100 and VIX pushes past 20 (likely on the backs of a renewed US-China trade war), a retest of the $108-110K lows becomes more likely.
What This Means for - ETH and by proxy, our beloved Altcoins
ETH has held up impressively through the recent liquidation. Structurally, this still looks like a breakout and retest of the key green supply zone. On the weekly chart, ETH also tagged the 21 EMA, which has historically acted as a solid medium-term support. As long as ETH holds above that EMA I stay medium-term bullish.
Similar to BTC, ETH looks range-bound in the short term with the upper range near 4800 (prior local highs) and the lower bound near 3500 (the liquidation wick). I don’t expect a full revisit of the 3500 lows unless macro conditions sharply deteriorate but a liquidity sweep into that zone remains possible.
If price can close above 4500 on higher timeframes (at least 1D), I’ll start to flip short-term bullish and start looking for a retest of the all-time highs; potentially even a breakout setup.
By extension, altcoins should mirror ETH’s rhythm: range-bound with gradual upside as BTC and ETH stabilize and grind higher. After such a large liquidation flush, there’s no strong case for outright bearishness. The leverage reset gives the market room to breathe.
Now, the real tell will come from macro signals: DXY, yields, and VIX which will decide whether crypto has the runway to retest the highs.