Metals are in big bull markets that have much more to go.The steep sell-off sets them up for another even steeper leg up.I am raising my gold target to $6800 from $5500 & silver to $180 from $125.Also raising my miner targets to the following:GDX $180,GDXJ $250,SIL $220,SILJ $90.
DAN ZANGER THE WORLD TRADER:
•Dan Zanger is best known for turning approximately $10,000 into over $42 million.
•This performance was achieved in less than two years, making it one of the most documented and respected trading records in modern market history.
•His results were independently verified and later featured in Investor’s Business Daily (IBD).
Early Trading Years
•Zanger lost money consistently for many years.
•He struggled with emotional trading, random entries, and lack of structure.
•The major turning point came when he studied William O’Neil’s methodology, especially the book How to Make Money in Stocks.
The Breakthrough Insight
Dan Zanger realized one critical truth:
Charts don’t lie. Price and volume tell the real story.
From that moment:
•He stopped predicting.
•He stopped fighting the market.
•He focused purely on high-probability chart patterns.
The Zanger Trading Method
1. Pattern Selection
•Tight consolidations (flags, pennants, bases)
•Strong prior uptrend
•Clean structure with minimal noise
2. Breakout Rule
•Entry only at proper breakout points
•No anticipation
•No early guessing
3. Volume Confirmation
•Breakouts must occur with significant volume
•Often 50% or more above average
•Confirms institutional participation
4. Risk Management
•Losses cut quickly (usually 5–7% max)
•Capital preservation comes first
•No emotional attachment to trades
5. Focus
•Only the biggest potential movers
•Avoids lagging or weak stocks
•Trades fewer stocks, but trades them well
Psychological Shift (Before vs After)
Before
•Emotional decisions
•Random entries
•Overtrading
•Hope-based holding
After
•Disciplined execution
•Pattern-based entries
•Risk-controlled trades
•Rule-based exits
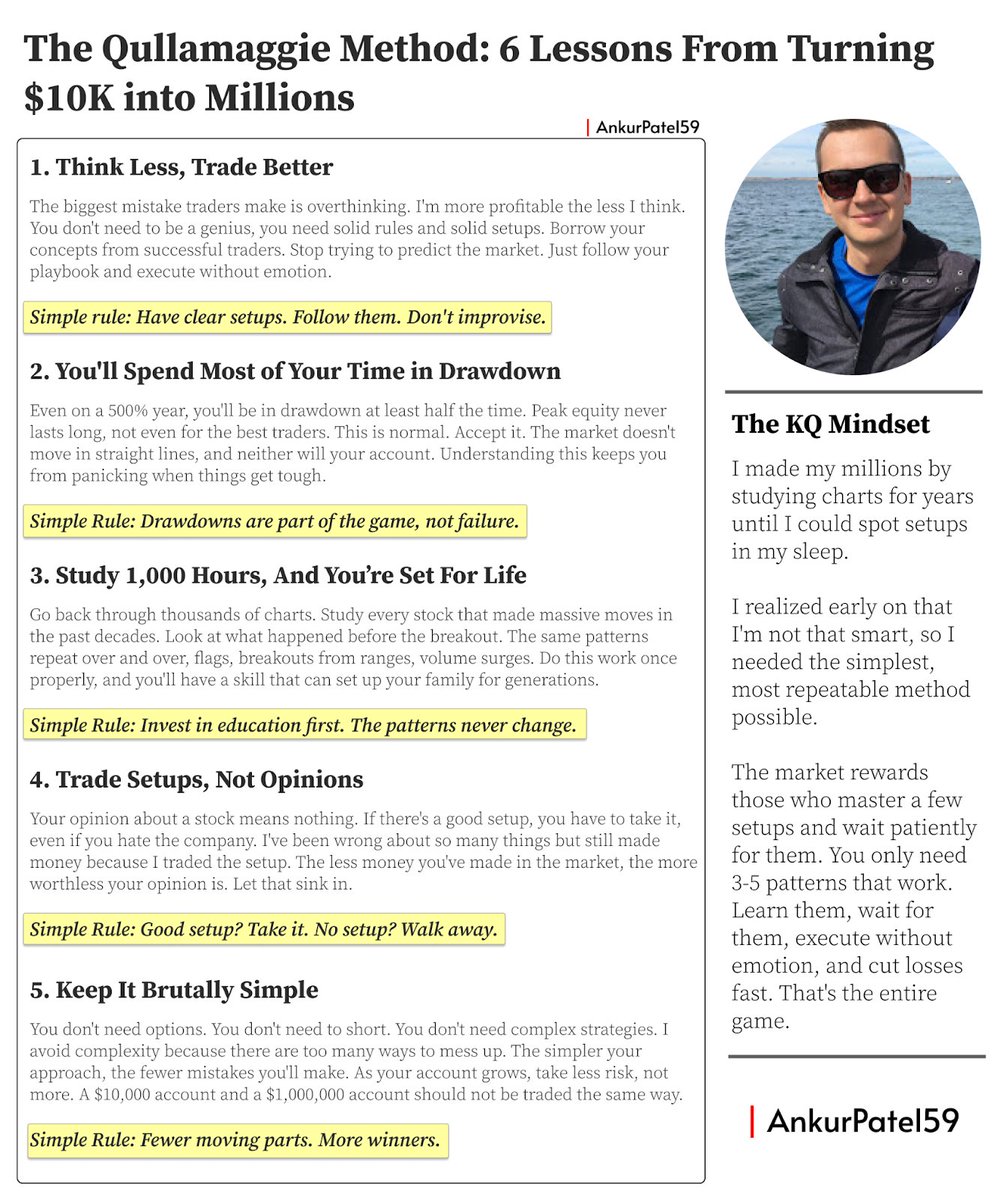
From $5,000 to $100,000,000+, Qullamaggie’s trading journey has been incredible.
What looks extraordinary on the surface was built through very ordinary decisions, repeated consistently.
Here are 6 lessons from his journey that can instantly help your trading.
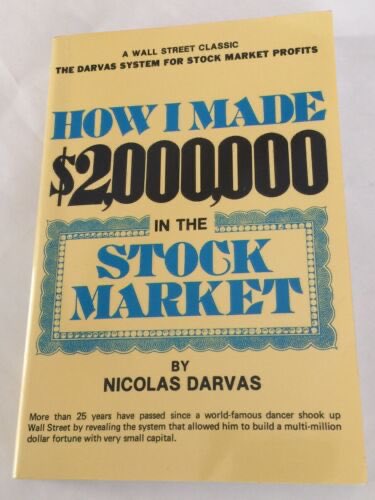
The $2,000,000 Nicolas Darvas System Summary:
An easy-to-remember acronym for the Darvas System:
D – Direction of the Market
A – Accelerated Earnings and Sales
R – Relative Price Strength (and Return on Equity)
V – Volume Increasing
A – Aggressive Growth Group
S – Sound Base Pattern
To further explain:
D – Direction of the Market
Is the market, as a whole, in an uptrend? It is highly unlikely that a stock will have huge gains when the overall market is in a downtrend, so make sure the direction of the market is moving upward.
A – Accelerated Earnings and Sales
Is the company seeing increases in earnings and sales this quarter compared to the same quarter last year?
Normally, you want to see stocks with at least 40% increases in earning AND sales in the most recent quarter compared to the same quarter last year. And remember, the higher the increase in earnings and sales, the better. If you have a choice between a stock with a 50% increase and one with a 90% increase, definitely go with the 90% increase stock.
R – Relative Price Strength (and Return on Equity)
Is the stock outperforming most other stocks in terms of its price increase?
Darvas wanted to see stocks that had at least doubled over the past year before he’d consider buying. If a stock has already increased a great deal over the past year, most investors are fearful of a steep decline, but many studies have shown that Darvas was right in his assessment; if a stock had already made a powerful move, it proved that it had the ability to move in such a fashion and therefore, was likely to do it again.
Another important characteristic of ideal Darvas stocks is a high Return on Equity. Fund managers love to see a high ROE. Some put a higher value on ROE than they do earnings and sales.
William O’Neil conducted a 50-year study on top performing stocks. This study’s findings were published in his classic book How to Make Money in Stocks. O’Neil found that almost all of what he labeled “the greatest growth stocks of the past years” began their runs with a Return on Equity of 17% or higher. And just like when it comes to earnings and sales, the higher the ROE is, the better outlook for the stock.
Therefore, with the exception of rare cases when earnings or other conditions are extremely attractive, we should primarily buy stocks with a ROE of 17% of higher.
V – Volume Increasing
Is volume increasing on up days, particularly on the day when the stock breaks into new highs?
Volume can tell you so much about a stock. Ideally, you want to see much higher-than-normal volume when a stock breaks into new highs and lower volume when the stock declines.
A – Aggressive Growth Group
Is the stock a member of an industry group that has been increasing in price more rapidly than most other groups?
At any given time in the market, there are certain groups and sectors that are very hot. It’s always been this way and always will be this way. Make sure your stocks are members of these hot groups.
S – Sound Base Pattern
A long term price range is established on a chart for weeks. The breakout of this range is the signal to go long to capture a potential uptrend. Use trailing stops to optimize gains and minimize give backs of profits.
🚨🚨 BREAKING:
Liverpool are now hoping to bring in Antoine Semenyo from Bournemouth in a £65m deal, with the Ghana international favouring a move to Anfield over Manchester City and Manchester United.
{@guardian_sport}
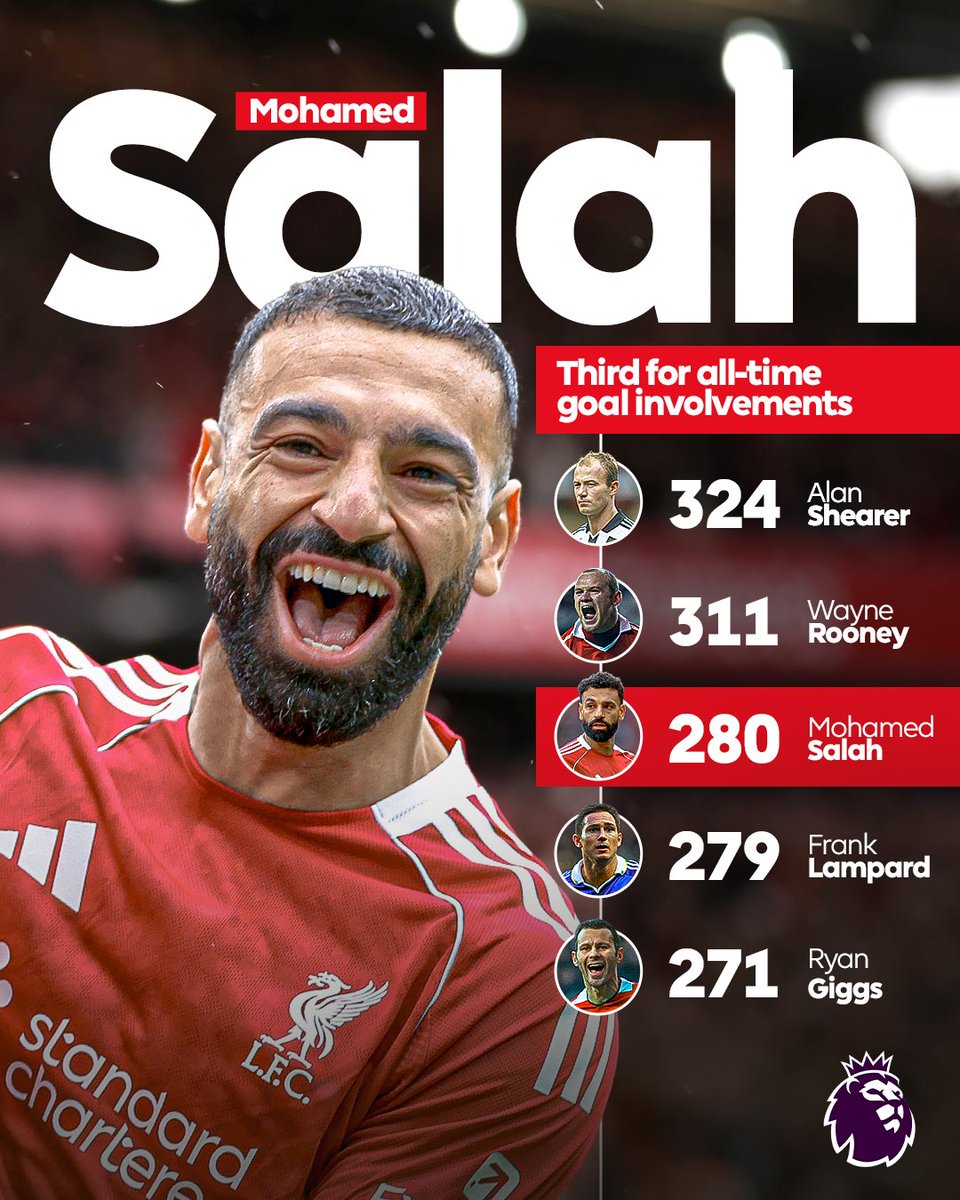
🚨 Mo Salah breaks the record for most goal involvement for a single side in Premier League history with an assist today! 👑
𝟐𝟕𝟕 𝐆/𝐀 generated for Liverpool in Premier League. 🤖🇪🇬