I've just finished creating a comprehensive trading workbook featuring my Millions trading plan, expert Fibonacci techniques, Price action mastery, The secret of ICT concept and much more. I’ve already shared it with hundreds of students in The Mastermind Club. For the next 24 hours only, it’s completely FREE for you. Just like this post and comment “X-71” — I’ll DM it to you right away.
I still favor a scenario where Gold drops to the 4540–4595 Daily FVG zone to sweep the two key liquidity levels I marked, before subsequently resuming its rise. Please read this carefully!
The trading plan I shared yesterday remains valid for today's US session.
The Daily FVG has not yet been tapped following the reversal signal (liquidity sweep) on the H4 timeframe; therefore.
XAUUSD Trading Plan – August 26, 2026
READ THIS PLAN CAREFULLY TO AVOID A $5,000 LOSS...
XAUUSD Trading Plan - August 25, 2026
✅H4 Chart: Looking at the H4 chart for a medium-term perspective, I maintain the same bullish bias as yesterday because Gold prices have not yet formed any strong reversal patterns on the H1 timeframe.
✅H1 Chart: However, an H1 liquidity sweep has occurred, and Gold has officially entered a re-accumulation phase within the 4560–4700 auction range. I strongly favor a scenario where Gold moves toward the Daily FVG at 4540–4595 to balance liquidity before resuming its rise—a healthy development in preparation for an upward trend.
⚠️ I will not be updating the bearish scenario at this time; should the market context change, I will provide an update!
Although I incorrectly predicted that Gold would form a short-term high to sweep liquidity at the 4450–447x zone, you can also see that buyers stepped in aggressively as soon as price approached the Flip Zone x Strong OB | 4300–4320 that I marked earlier this week.
XAUUSD Trading Plan - August 19, 2026
Today, because Gold has not yet swept the liquidity above, I see no reason for price to drop deeply and break below the 4300–4320 Flip Zone. Therefore, focus on buying with me, target TP around 4450–447x, and switch to SELL MODE once a Bearish CISD/MSS setup forms on the M5 chart.
Here is my forecast for gold price movements during the first two days of this trading week. The most recent daily candle indicates a bullish bias, so I anticipate a liquidity sweep at the recent high, followed by a decline to the key Flip Zone (4220–4238) before any subsequent move occurs.
XAUUSD Trading Plan — August 17, 2026
It’s been a challenging week with Gold giving us a tough run. That’s just the nature of the market—algorithms constantly shift price patterns over time, forcing traders to continuously adapt to stay consistently profitable.
Trading is by no means an easy profession. In my personal view, it's even more unforgiving than traditional high-skill fields like law or medicine. Naturally, high difficulty comes with massive rewards—and if you maintain this resilience over months and years, your life will undoubtedly enter a completely new chapter.
Wishing you all a fantastic weekend with your families. We will be back next week to keep conquering new profit milestones.
It doesn't matter whether you move FAST or SLOW, as long as you NEVER STEP BACKWARD.
Best regards!
— ALEX
TRADERS BUYING AT 4350 EXPECTING TO TAKE PROFIT AT 4500 ARE IN FOR PAINFUL LOSSES...
XAUUSD | August 13, 2026
That’s right, while I still maintain a bullish bias (Scenario #1)
I don't recommend buying right around 4350 – 4370 and targeting 4500 – 4600. Instead, stay patient and wait to enter alongside me at much better zones around 4223 – 4237 & 4301 – 4315.
When do I switch to FULL BEAR mode?
Once Scenario #2 is triggered—meaning Gold suffers a heavy selloff, completely slicing through the Strong Bullish OB | 4223 – 4237 and establishing a Bearish Breaker right there.
TRADERS BUYING AT 4350 EXPECTING TO TAKE PROFIT AT 4500 ARE IN FOR PAINFUL LOSSES...
XAUUSD | August 13, 2026
That’s right, while I still maintain a bullish bias (Scenario #1)
I don't recommend buying right around 4350 – 4370 and targeting 4500 – 4600. Instead, stay patient and wait to enter alongside me at much better zones around 4223 – 4237 & 4301 – 4315.
When do I switch to FULL BEAR mode?
Once Scenario #2 is triggered—meaning Gold suffers a heavy selloff, completely slicing through the Strong Bullish OB | 4223 – 4237 and establishing a Bearish Breaker right there.
BEFORE & AFTER 🍻
Even though Gold fell short of sweeping liquidity at 4476 as analyzed, you can still see how accurately the reversal zone was predicted.
Congrats to everyone who banked profits off this PLAN!
XAUUSD | August 12, 2026
BEFORE & AFTER 🍻
Even though Gold fell short of sweeping liquidity at 4476 as analyzed, you can still see how accurately the reversal zone was predicted.
Congrats to everyone who banked profits off this PLAN!
XAUUSD | August 12, 2026
XAUUSD | August 12, 2026
Today is CPI day. The H1 structure will remain largely unchanged until the data drops. My bias leans toward a sharp selloff in Gold once a liquidity sweep forms at 4435 & 4476 (the most critical zone).
Let’s see if reality plays out according to plan!
The white and red arrows indicate excellent entry zones that you absolutely should not overlook.
XAUUSD | August 12, 2026
Today is CPI day. The H1 structure will remain largely unchanged until the data drops. My bias leans toward a sharp selloff in Gold once a liquidity sweep forms at 4435 & 4476 (the most critical zone).
Let’s see if reality plays out according to plan!
The white and red arrows indicate excellent entry zones that you absolutely should not overlook.
Yesterday's XAUUSD trading plan remains fully valid; please refer back to it.
XAUUSD Trading Plan – August 06, 2026
Today, my bias leans toward Gold being in a short-term re-accumulation phase, setting up for a rally toward the 4320 – 4330 zone. Following that, I expect a pullback to 4207 – 4213 before price resumes its advance toward the most critical high-timeframe area: Monthly Flip Zone | 4355 – 438x.
That is my current outlook.
This is how we execute a standard trade that fully complies with the X-71 Strategy.
This material comes directly from our private Coaching Program inside X-Program. ❌ We don't SELL it—instead, we're sharing it FREE here so that every aspiring trader has access to genuine trading education.
The lesson is presented by Mentor Marcell, one of the core traders at XCapital.
Watch it carefully. If there's anything you don't fully understand, feel free to ask your questions to my inbox
Last week's market played out almost exactly as I anticipated. Our bias remained firmly on the bearish side. Although Gold created several bullish liquidity sweeps, the fact that price repeatedly failed to reclaim the key Flip Zones, or Decision Areas, tells us something important. When liquidity is taken but price cannot break through those major levels, it usually means Smart Money is hunting retail liquidity rather than building fuel for a sustained bullish move.
TRADE WHAT YOU SEE, NOT WHAT YOU THINK! 🤜
So, what should we expect in August?
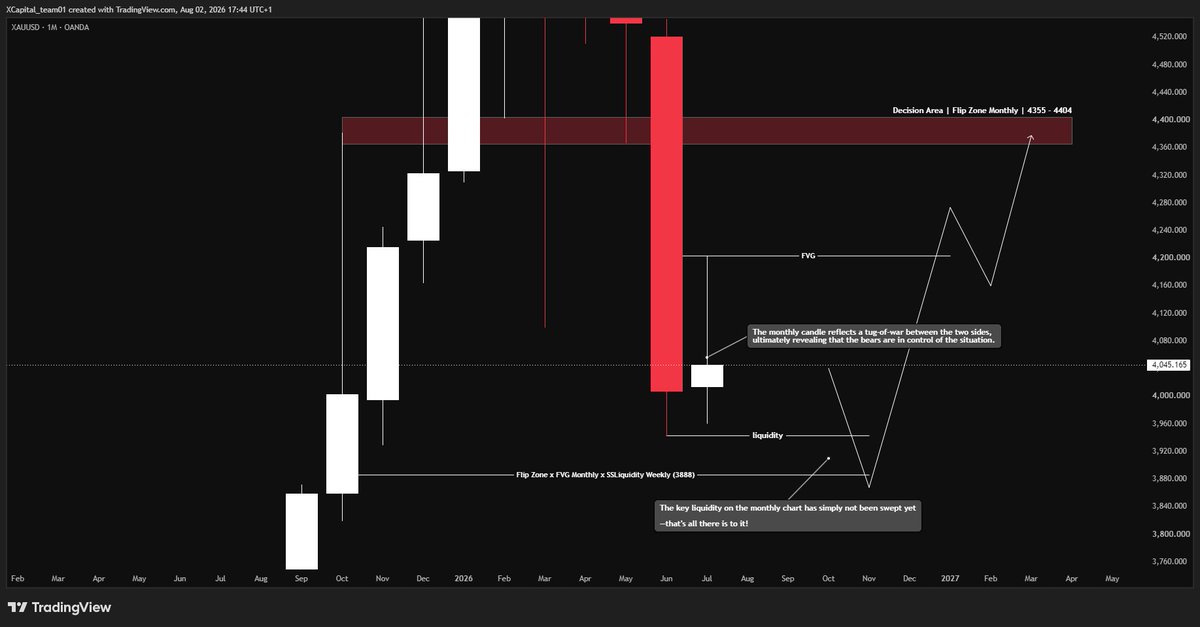
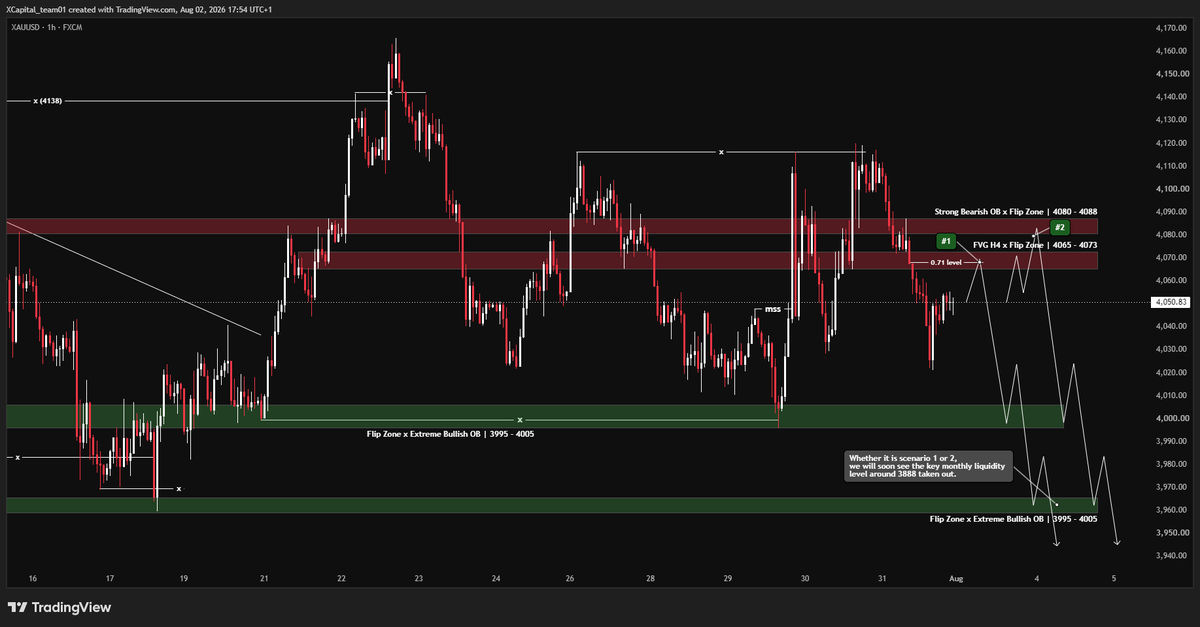
XAUUSD | August 02, 2026 (By Alexandre.fx)
I. Monthly Chart
The most important liquidity on the monthly chart has not been taken yet. That's the key point. My bias remains bearish until the liquidity around 3888, roughly the 384x to 3895 region, is cleared.
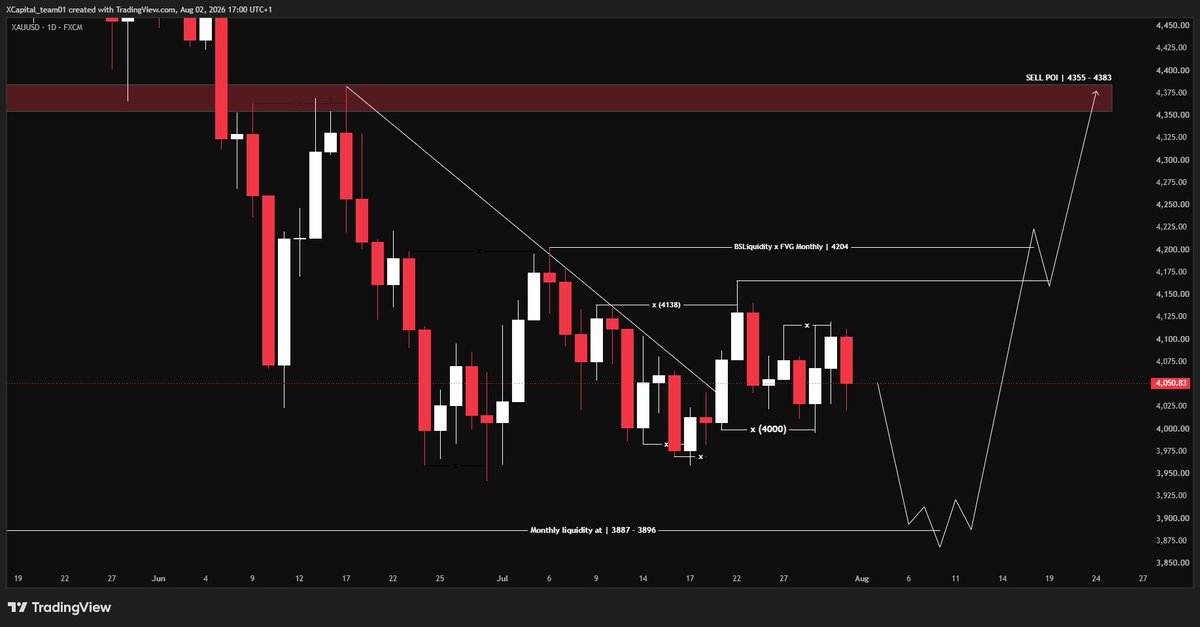
II. Daily Chart
The daily chart continues to reinforce the bearish outlook.
The bulls made an aggressive attempt with a Liquidity Sweep followed by a Bullish Market Structure Shift. They even managed to break the bearish trendline. However, the two bearish sweep setups that formed afterward allowed the bears to regain full control of the market.
III. H1 Chart
Whether scenario #1 or scenario #2 unfolds, I still believe Gold is likely to target the liquidity around 3888, the same level discussed above, where the Monthly Buy Side Liquidity aligns with a Monthly Fair Value Gap.
IV. When will I turn fully bullish again?
I will only become completely bullish if Gold forms a Daily Sweep and then delivers a strong bullish displacement above the Buy Side Liquidity at 4204. That would be my confirmation that the bearish cycle has come to an end. At that point, I would expect price to target the opposite liquidity objective, which is the Monthly Flip Zone around 4355 to 4404.
Everything behind this XAUUSD trading plan is built entirely on the concepts taught in the X-71 Blueprint 2.0.
It took me almost 10 years to develop this framework. You only need three months of focused training to build the skills required to reach a consistent four figure monthly trading income.
People talk endlessly about discipline. But without the right methodology, what value does discipline really have?
Leave "YOUR EMAIL" in my inbox, and my assistant will grant you lifetime access as soon as we're back in the office after the weekend break.
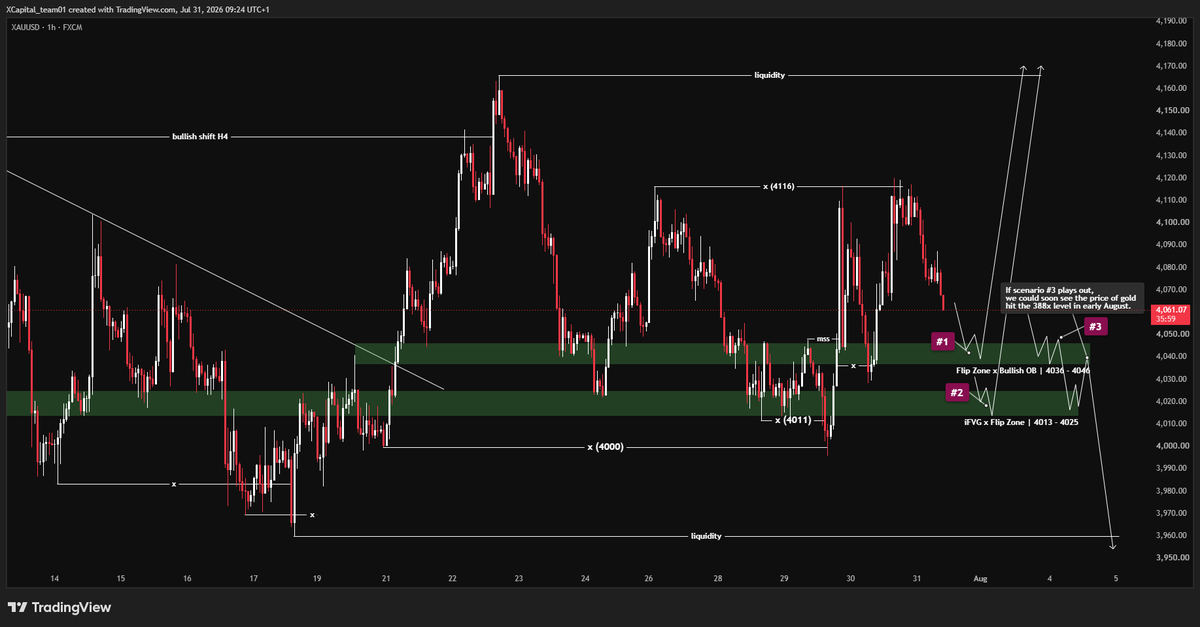
I'm simply leaning slightly toward the bullish side after the liquidity sweeps at 4000 and 4011, followed by a Bullish Shift (MSS) at 4047.
XAUUSD Trading Plan – July 31, 2026
There are 03 key scenarios you need to pay attention to, all clearly numbered and explained on the chart. We rely on pure technical analysis and structured market logic—not random predictions.
Today is both the last trading day of the month and Friday, which means volatility can become extreme. Stay sharp.
Tens of thousands of dollars have already been withdrawn from MT5 and funded accounts this month. Don't let an entire month's worth of disciplined work disappear in just a few hours.
XAUUSD THIS WEEK WON'T BE EASY. Most traders who become overly biased toward either the BUY or SELL side will get completely wiped out. Trust me now—you can thank me later.
XAUUSD – July 27, 2026 (by Alexandre.fx)
I) Daily Chart
No long explanation needed. The liquidity sweep and the bullish order flow breaking the previous structure are signs that the bulls are starting to step in aggressively, pushing the market into a re-accumulation phase before the next major move.
Keep in mind, this is re-accumulation, not a complete trend reversal on the daily chart. Don't confuse the two.
The two key reversal zones at 4355–4404 and 3820–3888 are something you absolutely cannot ignore if you're a swing trader.
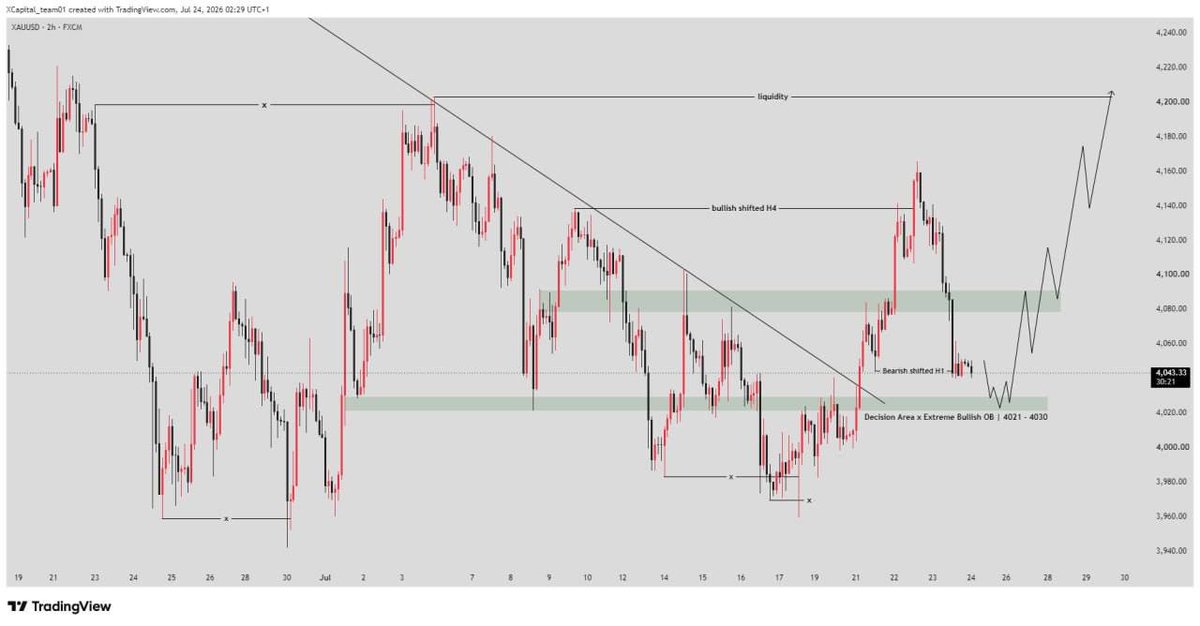
II) H2 Chart
A bullish shift formed, followed immediately by a liquidity sweep and a bearish shift. That's exactly why I'm warning you against becoming overly biased to one side next week.
However, the Decision Area at 4021–4030 is the key level to watch. Stay focused on BUY positions as long as this area holds. On the other hand, switch to SELL mode if the bears push gold below this zone with a confirmed breakout.
Pay close attention to the important Entry Zones I've marked with the green and red arrows.
You only need one or two high-quality winning trades each week to consistently grow both your personal live account and your funded account.
BEFORE & AFTER...
Last week's trading plan delivered outstanding profits for the vast majority of our traders, both inside and outside the The Mastermind Club.
Results like these don't happen by chance—they're built on years of experience & market understanding.
Congratulations to everyone who recognized the opportunity and made the most of it.
Well deserved! 😉
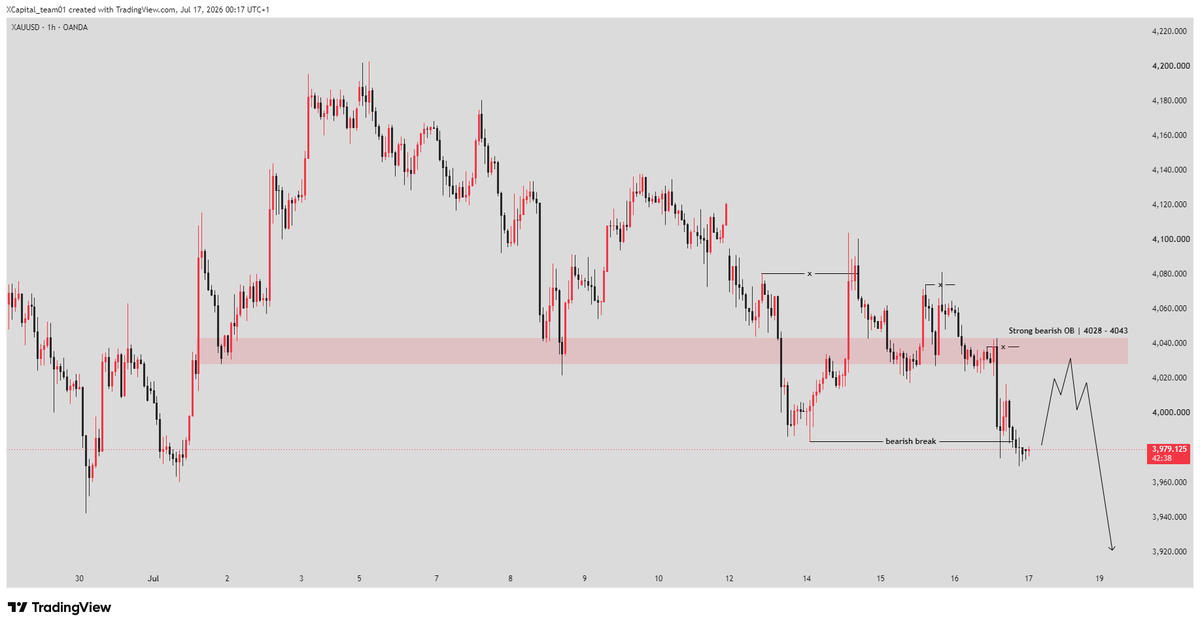
I accurately predicted the price drop on the Gold chart, and furthermore, the areas I marked as "strong zones"—where there was a high probability of a temporary price reversal—performed exactly as expected.
Technical analysis is a skill that will change your life—believe me!
XAUUSD - July 16, 2026
Before & After.