@jimfurtado I realize you think the world of Driveline, but genuine hitting experts looking at 58.6% hard-hit rate, 92 mph average exit velocity, and zero home runs in 40 games should immediately recognize that timing is eliminated as the primary cause.
@GeoffRottmayer 1-for-18 with an 82 DQS may or may not be variance.
it's not bad luck if the contact is coming from bad zones, poor depth, bad spray fit, or hard contact that doesn’t convert. That’s the Tatis problem: elite force, broken damage conversion. DQS is not the full diagnosis.
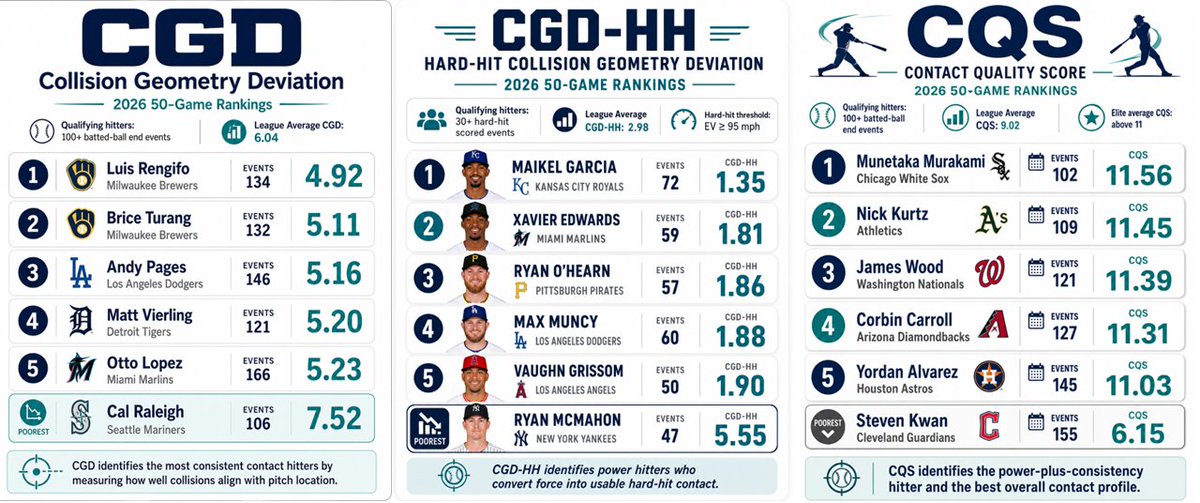
This is exactly what a real contact-quality leaderboard should look like.
The top 5 are not just big EV names. They are hitters whose contact quality holds up through collision, force, and outcome.
The bottom names make sense too: contact alone is not damage-quality contact.
Driveline reduces the problem to "timing" and prescribes further diagnosis in the lab. Timing? How can a timing problem produce an elite Hard-Hit Rate? Causal analytics answers the question: What is the cause of Fernando Tatis Jr.'s Power Outage?
https://t.co/WQMoXmIxLv
50-game Causal Analytics rankings.
CGD shows collision consistency.
CGD-HH shows usable hard-hit power.
CQS shows power plus consistency.
Three metrics. Three hitter identities. One collision-level view of how production is built.
50-game Causal Analytics ranking for MLB hitters and teams. Collision alignment. Hard-hit energy conversion. Overall contact quality. The rankings also show which team-level patterns may reveal organizational hitting philosophy. https://t.co/1L50PCF9jB
Everything in Tatis's 40-game data points to 2 things: 1. early barrel entry and a tight swing arc & deep contact (sound familiar) and terrible leverage count swing decisions. This isn't opinion, the data alone tells the story: https://t.co/h3XG3mEGyx
Fernando Tatis Jr.’s 40-game profile exposes the gap:
58.6% Hard-Hit
92.0 mph Avg EV
.327 BABIP
.293 xwOBA
.048 ISO
0 HR 3 XBH
BABIP is above average. Bad luck on balls in play doesn’t explain it.
xwOBA doesn't see cause.
https://t.co/h3XG3mEGyx
Read How New Analytics Solves the Question Everyone is Asking: How does Fernando Tatis Jr. produce a 56.6% Hard-Hit Rate with zero home runs? Collision-level analysis points to: -1.83° Avg Horizontal Barrel Angle 3.66° Avg Spray Angle-12.6° Avg LA
https://t.co/h3XG3mEGyx
@jimfurtado Also, Moneyball is chess- expected outcomes of the pieces. True Moneyball is, in order to win a WS, the Redsox had to pivot back to the NYY system: purchase better pieces than your opponent.
@jimfurtado@JLucroy20 Well, I'm not teaching anything, actually. You can begin here: Article- https://t.co/xY3EQ2LHiA
The questions data can thoroughly answer are limited to the experience and knowledge of the subject. We can discuss GRFs if you like.
@GeoffRottmayer All public facing metrics in batting are outcome based, no different than batting average. Even predictive metrics like xwOBA and BABIP are based on outcomes. This is where Causal Analytics come in.
@_dadler Are you familiar with the availability heuristic? VBA changes by wrist articulation vs. anterior pelvic tilt. Postural adjustments that still produce successful collision within constrained time windows are usually outliers, making this observation mostly anecdotal.