Founded one of the first synthetic grass & golf systems companies in the US in 1998. I consult on large golf systems projects world-wide. Avid crypto investor.
@HorridHenree Nowhere in any post, on any asset, have I ever said my analysis is based on my gut???? My analysis is based on the charts. This comment borders on ridiculous!
$LTC is still on track towards my estimated target area within the coming days. Price could hit anywhere within the box. Again, we re-evaluate price action if and when it hits the target area.
To isolate what type of corrective structure $BTC, or any asset might be forming, always go to the lower time frames to see the details you won't see on higher time frames.
This is a rising, parallel channel after a downtrend on the 15M chart. This is typically a bearish structure (bear flag) so I would anticipate price to break downwards after it has consolidated long enough within the structure.
$BTC dominance just hit the upper rail of the symmetrical triangle structure within the macro, ascending parallel structure. I would anticipate a possible path that looks something like this as I don't think it will be ready to leave that structure on a push down to the lower rail quite yet.
If this doesn't happen, and price breaks up, you will see Bitcoin run up stronger than alts, although alts will still follow.
This could eventually play out as a new high for Bitcoin before the end of the year and then a correction. Alts typically go into an altseason after Bitcoin has made a new high and goes into a correction. Alts keep running while Bitcoin is correcting as $BTC profits roll into alts.
If the dominance breaks the lower rail and falls out of the macro structure as well, we could see an earlier altseason than normal. There are always several options to consider:)
@LatAmPapi@RobinBullZ This guy just got blocked for ridiculous comments. One of those people who have nothing better to do than troll accounts they don't even follow.
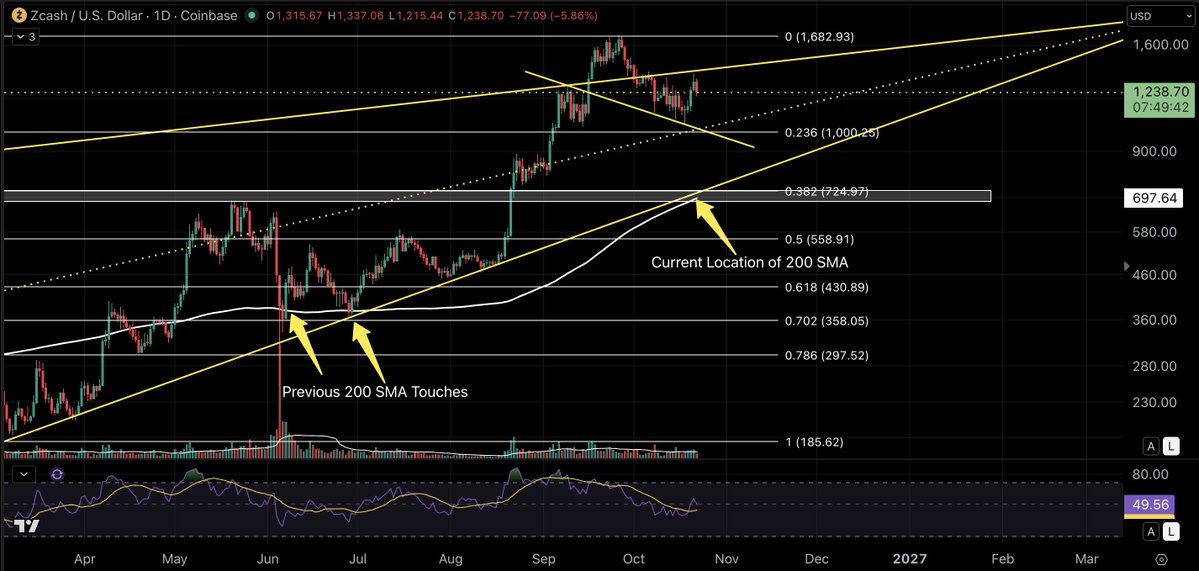
Let's take a look at $ZEC on the macro daily chart again. As you can see, price often comes back to retest the most important moving average, the 200 SMA, after a large move up.
Since the most recent parabolic rise, price has moved far above the 200 SMA. Currently, this moving average has entered the area where I've indicated would be the healthiest retrace area for Zcash to reset structure.
Now, this isn't a guarantee price goes there because price might only go as low as the 1K area if this pullback continues. However, the confluence in the area around $700 is substantial:
- previous area highs that were once major resistance
- the macro .382 fib level
- the 200 SMA
This is how you create a logical, technically viable analysis that should work into your risk management strategy.
This has NOTHING to do with the quality of the asset or any narratives surrounding the asset. It is strictly chart technical analysis for risk assessment.
No guarantees, just possibilities to consider...as always:)
algorand:native is still right on target towards my estimated pullback area within the next day or so. How it reacts at that level will determine price action.
Of course. It's still a viable structure until the price of the right shoulder goes above the head.
Understand that Zcash is a highly volatile, heavily leverage traded asset so many of these huge price swings that move well outside of structure are simply liquidation moves.
Exchanges don't want leverage traders making 100X on a leverage trade so the name of the game is to try and liquidate as many as possible before a local bottom and reversal.
@XRPathologist Your chart looks like a mess. Trading is not a scribbling arena. Like if you’re a secretary with your paper work all over the place. Regardless of price technical analysis I rate the readability 2/20. Failed the exam
@DieWelle69 My primary influence is probably Jesse Livermore. He did what he did in a time with no computers or fancy indicators, only a ticker. That's why my strategy is so simple. The fundamentals will always apply.
For $ZEC, price has pushed up to just below the price it needs to break to create a higher high. Same rules apply for me which is price acceptance above that level, and not just a wick.
As you can see, on the 4H chart, the 200 SMA, .5 fib level and order block are right around that level so price needs to work through all of those indicators. As well, RSI is pushing into an area where we've seen corrections previously.
As always, we want to see expanding volume at this key level to create the necessary strength to push through it.
@DieWelle69 Thanks. It makes it all worth it when I hear comments like this. Ultimately, my goal is simply to help everyone manage risk as much as possible:)
$ZEC wicked above the previous high, but I still do not consider that a valid higher high.
Why?
Because price never showed real acceptance above that level.
A wick alone doesn’t do it for me. I want to see at least part of the candle body above the prior high, and ideally a daily close above it.
Instead, price pushed through the level, failed to hold it, and is now dropping back into the prior range.
That looks much more like a liquidity sweep/failed breakout attempt than a confirmed trend reversal.
For me, the structure is still simple:
- No accepted higher high.
- No confirmed higher low.
- No trend reversal.
Now price is back around the .382 Fib near $1,244.
Below that, the .50 is around $1,131 and the .618 is around $1,027, right in the area I’ve already been watching near $1K.
Until $ZEC can make a real higher high with acceptance and then follow it with a higher low that holds, I’m still treating this as part of the larger corrective structure.
The green candles were impressive.
The structure still isn’t.
#ZEC #Zcash #Crypto #TechnicalAnalysis #MarketStructure #PriceAction #Fibonacci #Liquidity #TradingView
$ICP is still on track towards my estimated target area.
Are you seeing this theme to my thesis yet?
The market, and particularly the assets I'm watching, is still tracking in unison with $BTC up to this point.
$BTC is still following the roadmap I’ve been watching.
Bitcoin pushed higher into resistance, failed to establish a meaningful higher high with acceptance, and has now rolled back over.
That keeps the broader corrective structure intact.
My original target remains the same because the confluence is still sitting there:
- The .702 Fib around $78.4K.
- The lower micro trend rail.
- The 9-year macro trend rail.
All three are converging in roughly the same area.
That’s not an arbitrary price target. It’s multiple forms of structure pointing to the same zone.
And this does not make me macro bearish on Bitcoin.
Quite the opposite.
A flush into the $78K–$79K area, followed by a strong reaction from a 9-year logarithmic support rail, could be exactly the kind of reset needed before the next major move higher.
The key will be what price does when it gets there.
A wick below followed by a fast reclaim would not concern me nearly as much as daily acceptance below the macro rail and the .702.
Until price proves otherwise, my thesis remains unchanged.
#BTC #Bitcoin #Crypto #TechnicalAnalysis #MarketStructure #Fibonacci #PriceAction #TradingView