If you have a plan, stick to it.
Valhalla or hell.⌛️
"
If the pattern repeats 1:1, Bitcoin would likely sit around $78–79k next week, then pump into $82/83k.
Key level to watch is the 50 weekly SMA (currently $78.2k). If BTC finds support there, the path toward $100k stays open.
If Bitcoin rejects at the previous May high, I think the 50 weekly EMA will be the next big test for Bitcoin (currently $76,500). "
bitcoin:native
Nailed. 🔨
Don’t end up as exit liquidity.
Today you’re gonna see the final pump, before Bitcoin dumps at the start of next week.
See you next week. ⌛️
bitcoin:native
Good morning ☕️
After Bitcoin printed the wick below the green TEM zone, I said we could grind sideways toward $85–87k from there. ✅
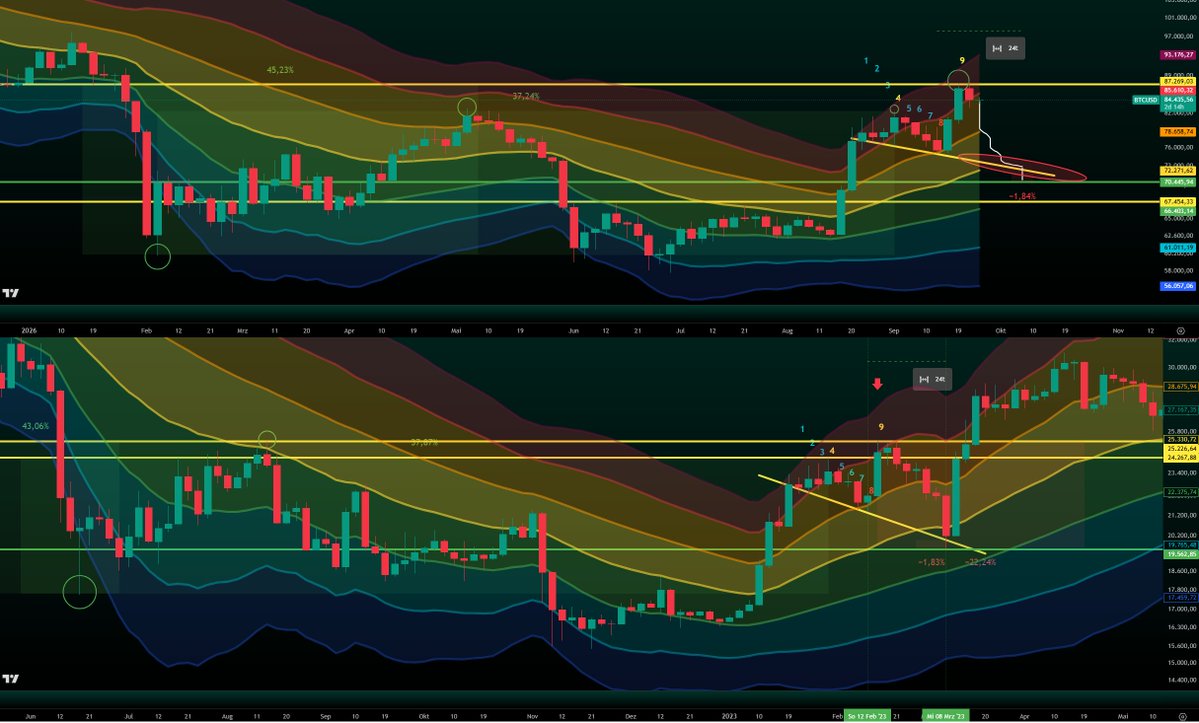
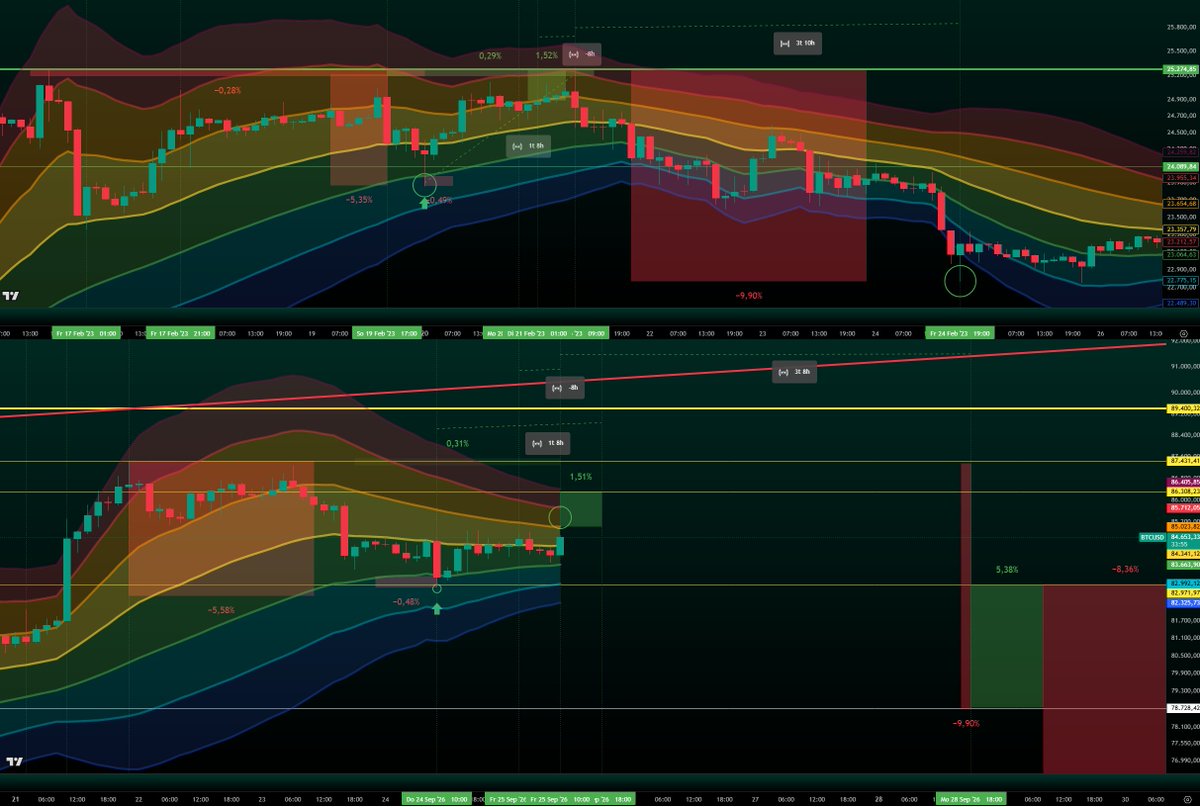
In 2023, 8 hours before the peak, BTC touched the dark orange zone and printed the high 8 hours later.
If the pattern repeats 1:1, measured from the dark yellow box, the high could be $86,300.
I expect today’s move to be the last and final pump, until the daily close. ⌛️
There is also a chance that $87,330 was the top. 🚨
What I’m expecting after the last pump?
If the pattern repeats 1:1, Bitcoin would likely sit around $78–79k next week, then pump into $82/83k.
Key level to watch is the 50 weekly SMA (currently $78.2k).
If BTC finds support there, the path toward $100k stays open.
If Bitcoin rejects at the previous May high, I think the 50 weekly EMA will be the next big test for Bitcoin (currently $76,500).
If Bitcoin reclaims the $86,000–$87,300 zone, I will open a short position.
If Bitcoin drops toward $78,000-$79,000, I will open a long position and rebuild my swing long down to $70,500, with a max target of $67,500.
This is a high-timeframe (1W) pattern! Delays or deviations may occur on lower timeframes than 1W.
bitcoin:native
Good morning ☕️
As I said, there is a chance that Bitcoin goes below the green TEM zone, exactly like it did in 2023, before pumping back to the previous highs.
Bitcoin printed a wick below the green zone today.
Bitcoin could go sideways toward 85–87k from today, but i doesnt mean to play out like that on the LTF.
There is also a chance that $87,330 was the top. 🚨
This is a high-timeframe (1W) pattern!
Delays or deviations may occur on lower timeframes than 1W.
If Bitcoin reclaims the $86,800–$87,300 zone, I will open a short position.
If Bitcoin drops toward $79,800, I will open a long position and rebuild my swing long from $79,800 down to $70,500, with a max target of $67,500.
Next week should turn bearish.
Bullish sentiment will break, and the same bears that flipped bullish will turn bearish again. ⌛️
What I expect over the next two weeks:
Scenario 1:
From Sep 28 to Oct 7, a dump to $79k, hold $79k.
From October into November, road to $99k–$106k.
Scenario 2:
Dump to $79k, 5% bounce, then dump back to $70.5k into Oct 12.
After that, pump toward mid $90k's by November.
It doesn't necessarily mean it has to happen again!
Bitcoin is in the overheated zone, but only on the 4h timeframe.
The 4H and higher timeframes are the most reliable and strongest for the Paranoia Indicator (LTF!).
We’ve either dropped right around the moment the black bar entered the red zone, or we’ve been stuck in the overheated zone for multiple days, which causes the black bar on higher timeframes to slide into the red area as well.
This means we could see multiple pumps, or the local top for now is in. ($86,300)
That would also align with the view that Bitcoin marked its high on Monday and the sell-off will continue thereafter.
bitcoin:native
Don’t let yourself be used as exit liquidity.
I published this pattern already in August, before the breakout.
After the final red 3 of the 1-2-3, the large breakout candle printed.
Exactly six weekly candles later came the last push, then the dump.
If the pattern repeats, Bitcoin could print the high this week and then dump, starting around September 28 and extending into early or mid-October.
A bottom around the $73,700 level cannot be ruled out.
Once this level breaks to the downside, $69k–$71k is next.
It doesn't necessarily mean it has to happen again!
bitcoin:native
Everyone’s hunting for a reason again, Clarity Act, headlines, whatever excuse fits.
The HTF pattern was already there.
I refined it on the LTF so you could see it yourself, a clean copy-paste!
After the $82k rejection I said the target was the $75k zone, max $73k, within two weeks, then a pump back to $80k+.
Bitcoin doesn’t care if the Clarity Act passes, and it doesn’t need anyone.
If you’re still looking for news after the move, you never saw it.
The breakout in my previous video was marked for 2-4pm.
Rule number 1: Stick to your plan.
Voilà. 🎯
I've warned several times in Discord when I exit the trade and when I get back in.
It took a full 3 attempts before Bitcoin finally found support.
I now expect the move toward $80,000 to continue, followed by a dump to $70,500–$71,000. ⌛️
https://t.co/6atyr1dSg7
bitcoin:native
You already know the Paranoia Indicator and what happens when the black bar goes into the red zone.
This time I’ll show you what happens whenever the black bar enters the green zone on the 12-hour timeframe.
Of course, you also have to be able to understand when we’re in an uptrend and when we're in a downtrend.
The Paranoia Indicator shows good long entries and the perfect exits.
There’s still a chance to hit $73k to $75.5k, check out my previous Thread!
The brilliant genius behind that indicator is my brother
@thebtcfrontierX
He deserves every follower, make sure to follow him.
bitcoin:native
I would call it a textbook pattern if we dump this week.
I called that a month ago and it played out perfectly.
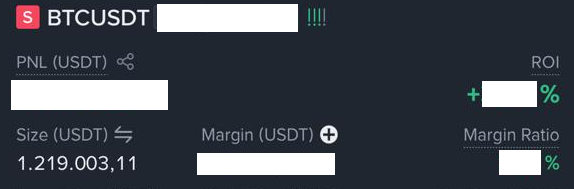
That’s why I closed my swing long position for $290,000 profit.
Don’t miss any live updates and join XAPA’s WORLD.
https://t.co/6atyr1dSg7
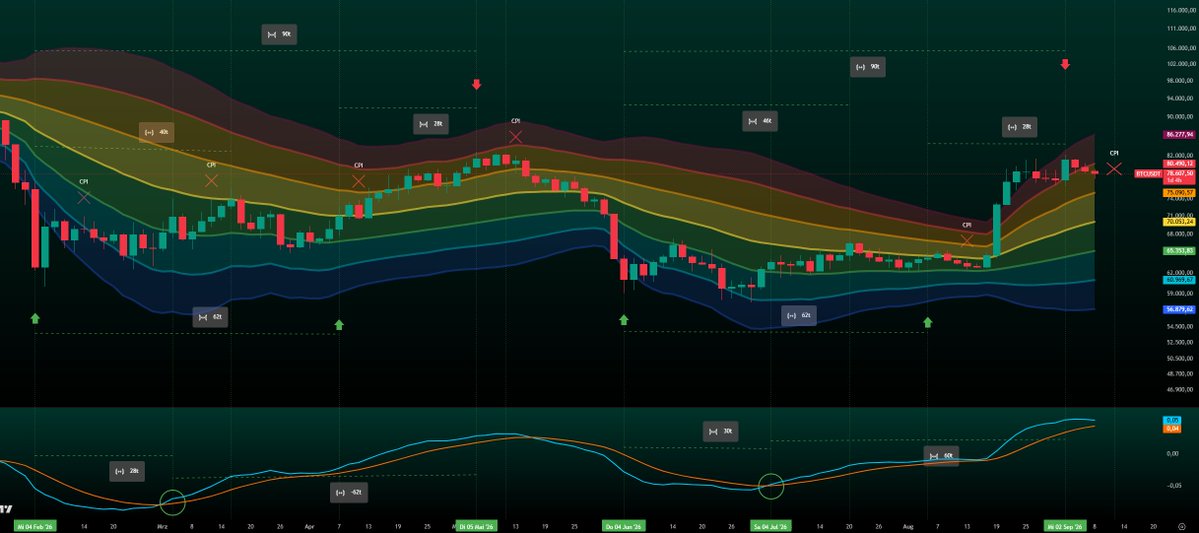
From the red candle outside the TEM until Bitcoin first touched the yellow zone it took 40 days, and that was followed by a correction into the light blue TEM area. Measured from the same point outside the TEM, it then took 62 days to touch the yellow line again.
After those 62 days we only saw a minor correction that never left the green zone, which is a strong support area. CPI data releases happened at both of these points. Overall it took 90 days on the 2D chart to reach the red TEM zone, just 6 days before the CPI release.
If this pattern repeats, the top would form around early September. 🎯
bitcoin:native
I'm often asked where I'd best open my long.
I point to the pattern, it's played out perfectly so far.
According to the pattern, this week could start bullish and then drop toward $73k.
I see Bitcoin falling toward $73k–$75k over the next two weeks.
I'll start scaling in from $75k with a max of 20% to avoid getting front-run.
I expect a pump to $86k once Bitcoin reaches the $73k–$75k target.
My largest order will be at $67.5k.
You can see the Ichimoku Cycle Engine in the video, and you'll also recognize the similar behavioral pattern from 2023.
the genius behind every indicator i am using is my brother
https://t.co/Q7leQj5tEB
Follow him, he deserves it!
bitcoin:native