Don't get fooled by bad math.This graph compares percentage growth rates rather than actual progress.
It's "base effect" distortion.
1 ➔ 10 = 900% growth (added 9)
100 ➔ 500 = 400% growth (added 400)
Adding 400 is objectively bigger, but this chart uses "percentage of percentages" to make the 9 look superior because it started near zero.
So it's completely designed to make the earlier govt look better.
Now judge yourself and your maths.
We are living in a country, where abusing The Sitting Prime minister and his Late mother is "Freedom of speech".
But calling a random do kaudi ki girl as BKL (Beautiful Khubsurat Ladki) and sending a normal ❤️ become a crime.
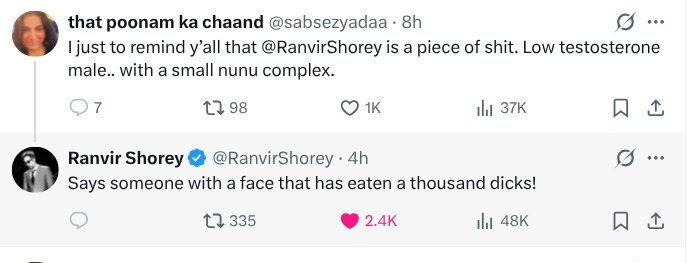
Ranvir Shorey it's not your fault, Man.
🚨 CONGRESS LEADER : Media is very selective. They did not show Jantar Mantar protest but extensively covering Jharkhand protest. Why they are not finding foreign angle here like they did during Jantar Mantar protest? 😳
PRADEEP BHANDARI : "Jharkhand students are not even asking for a resignation, they are only asking for the cancellation of the examination and a CBI probe"
"Rahul Gandhi has the time to go to Uttar Pradesh, but he does not have the time to go to Jharkhand?"
"I am appalled that Congress leader on the show has called them as foreign agents" - @pradip103
@SarinaSamael The mid leftists beeches want her to be a standard fir beauty so they can score a 6 on the scale while in reality they are mostly 1 or 2.
Congi IT Cell Intern made this graph in haste and sent it to Dhruv Tatti, because majority of the comparisons here carry denominator fraud
Take for example the internet user base
Internet users rose by 247 million before 2014, but by 838 million after 2014
So only 23% of the total increase in internet user happened before 2014, not 94%!
The Matrix Team have hit them where it hurts