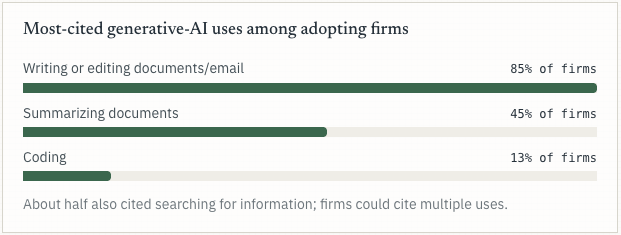
Census data from hundreds of thousands of US businesses shows AI use nearly tripling since 2023 with virtually no net effect on employment so far.
In the Nov 2025–Feb 2026 Census supplement, 95.7% of firms reported AI caused no change in total employment.
Business AI use rose from 3.7% in September 2023 to about 10% by late 2025; a broadened November 2025 question measured roughly 18%.
Among AI-using firms, 44% say it enhanced existing employee work while 10% say it took over an employee task.
So, don't listen to the doom and gloom experts.
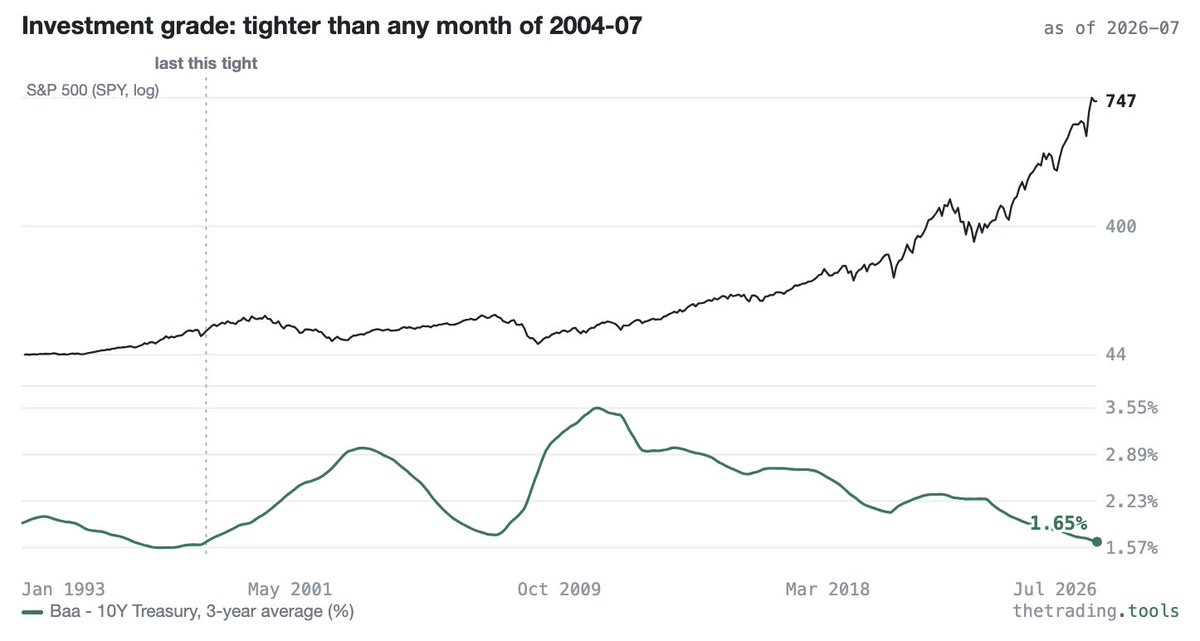
The three-year average of the Moody's Baa corporate yield minus the 10-year Treasury sits at 1.65% — and the last month it was this low was October 1998.
Before a meaningful top can occur, this indicator needs to start going up again. Hasn't happened yet.
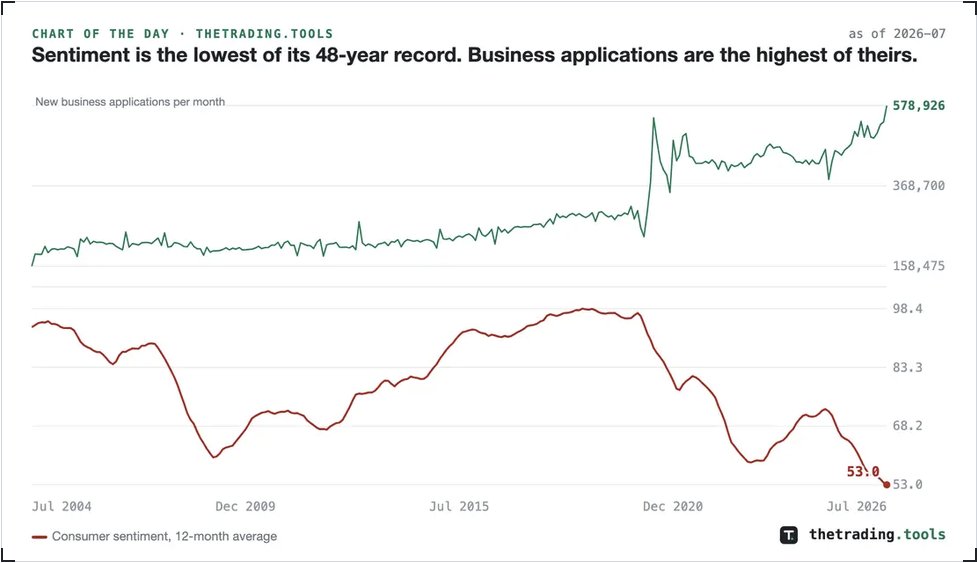
Consumer sentiment’s 12-month average fell to 53.0 in July 2026. That is the lowest reading of the average’s entire record, which begins in December 1978. The eight lowest readings in that 48-year record are the 8 most recent months. The comparison worth having is with the prior troughs: 61.0 in 1980, 60.1 in 2008 and 59.0 in 2022. Today sits below all three.
New business applications reached 579K in the same month, a record for a series that starts in July 2004, up 23.4% from a year earlier and close to double the 2019 monthly average of 293,134. Since January 2023 the two series have a correlation of -0.77 across 43 months, so they have been moving in opposite directions for more than three years rather than crossing once.
A survey measures how people say they feel and an application is something a person paid to file, which is the reason to weigh the second more heavily.
$IWM Russell 2000 led this market into a sell off. The small caps index is sitting at a very peculiar spot, which can provide a strong support for prices. You all know this pattern.
$SPY Trading is a game of probabilities. Consider this: NYSI got to almost -1100 on Christmas Eve and just now starting to move up. As much as I want to short the market, probabilities just don't favor this stance right now; unless NYSI turns red again and start going lower.
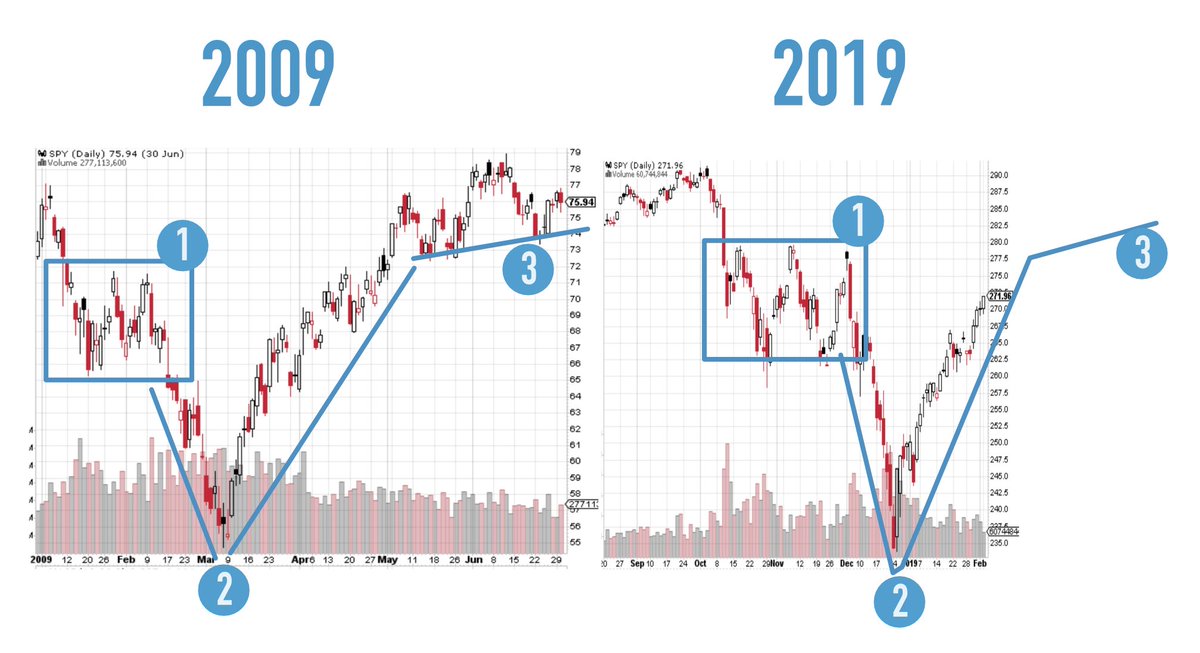
$SPY 2009 vs. 2019. This scenario can also unfold and it will crush all bears and it will be EXTREMELY BULLISH for the stock market going forward. There will be no Bull Traps - only ONE BIG BEAR TRAP.
$SPY $LQD 2008/9 vs 2018/9. If you still doubt the bull run, consider this HUGE bullish divergence between the stock market and the high grade corporate bonds. For the market to start selling off like CRAZY, we need to see CRAZY weakness in the LQD.
2019 vs 2009 update. When I first posted the comparison (3 weeks ago), some folks laughed. If they were short the market, they are not having as much fun now. In any regards, for the market to continue higher, it will have to go over 50d MA as it did in 2009.
$SPY 2009 vs 2019 update. 50dMA was cleared today! As in 2009, I would expect the market to come back to the 50dMA next week. If it holds, the next move will be 5%-7% higher. (I will share later another very bullish development).
A month ago I published my first 2009 vs 2019. Most people didn't pay attention, some laughed at it, others said it was outright crazy (e.g., apples vs bananas). I guess those guys didn't trade in March - April 2009 - I did. I shorted the market like crazy :)