@ieee_tvcg Want to construct multiple-view visualization? Nebula allows users to use several natural language sentences to coordinate views. @crcrcry2 Check out the paper at https://t.co/cTRoBsa3Jn. You can also visit our gallery at https://t.co/mXcRuKQK24 to learn more.
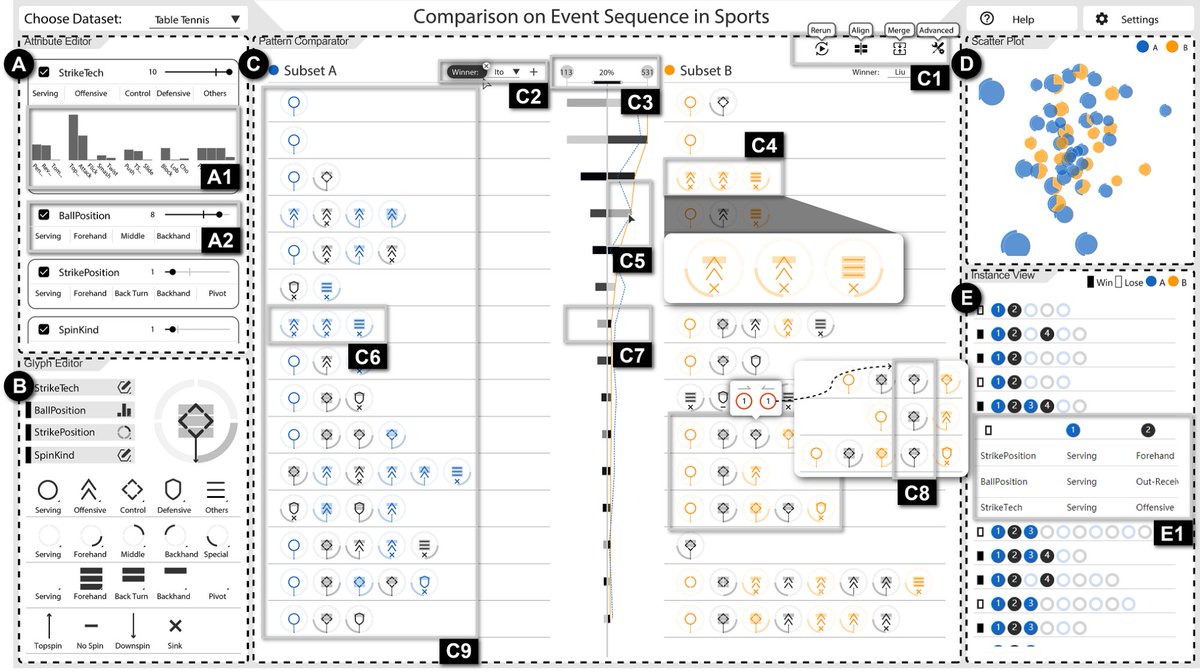
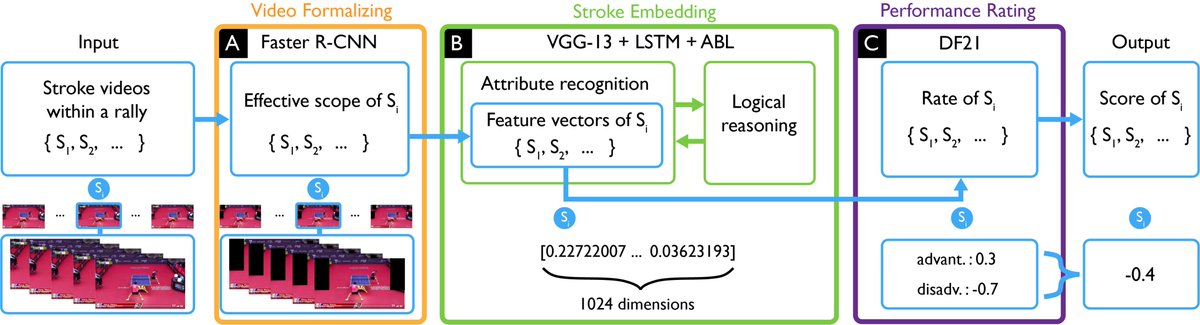
@kdd_news How do the top table tennis players perform each stroke during a match? Who is good at offense? Who is an all-rounder? Tac-Valuer can tell you the most details. Check out our paper at https://t.co/NfhJEjzVZN to learn more.
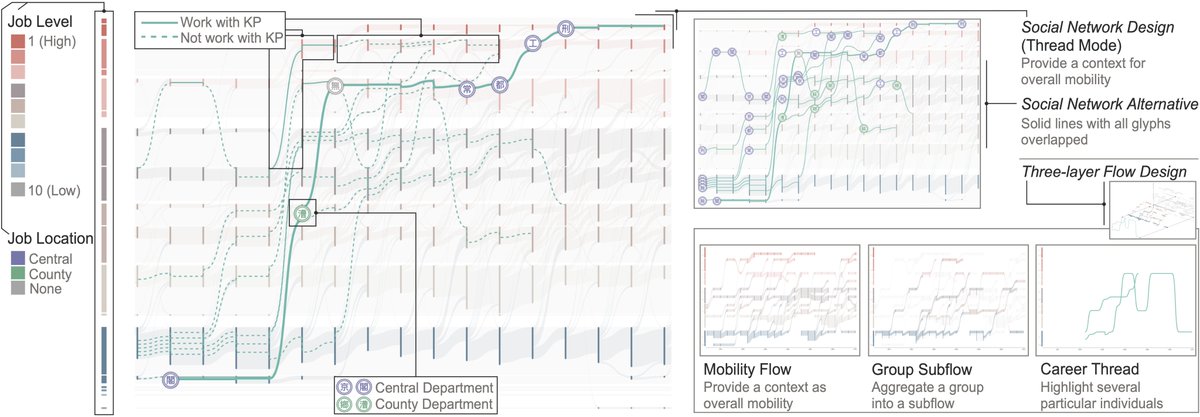
@ieee_tvcg What are the secrets lying in one's career's promotion/demotion? CareerLens can show you the hidden rules of career mobility and the invisible cliques in the Qing bureaucracy of China! @yifanginhz Check out our paper at https://t.co/4Qt5xW131G to learn more.
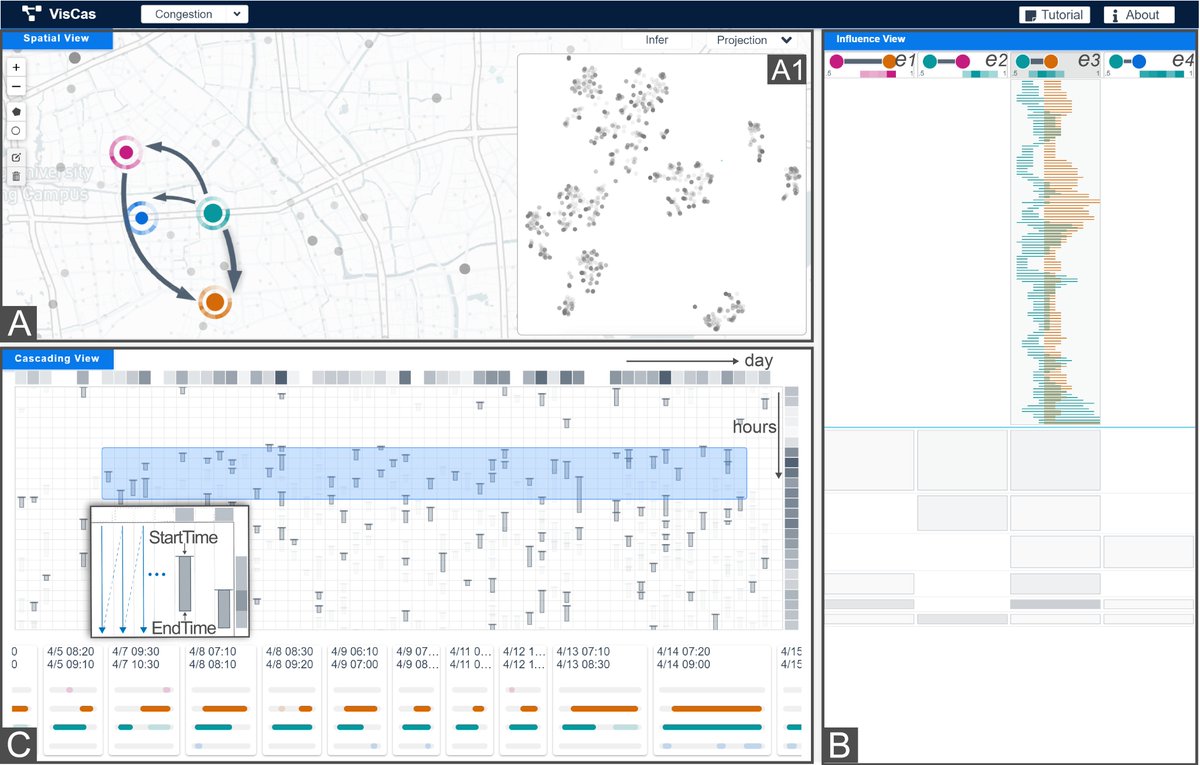
@ieee_tvcg Do you experience traffic congestion every day when you go to work? Our system can help you understand the problems of a city, how these events happen, how they spread, and how they affect your lives. Check out our paper at https://t.co/4QFxQTyvzo to learn more.
@PacificVis@ieee_tvcg What are the secrets of the table tennis world champions? Tac-Miner allows you to discover the characteristics and the strengths and weaknesses of the world’s top players! Check out our paper at https://t.co/WuPKiqE0uV to learn more.
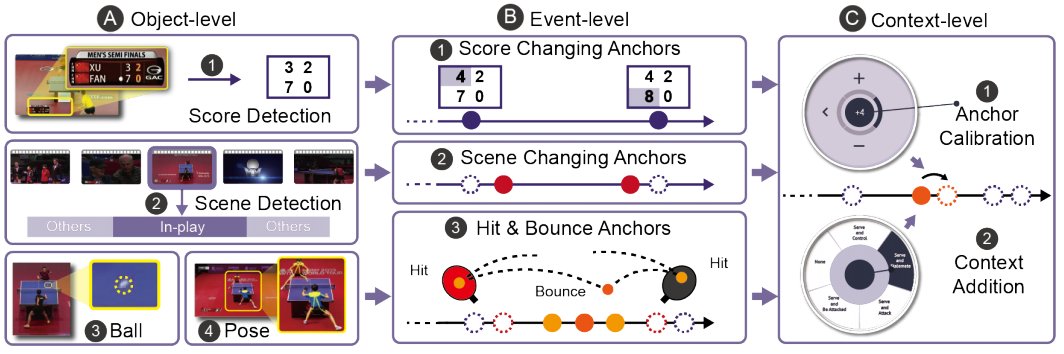
@sig_chi Want to create a highlight collection for your favorite player? Or want to collect sports data for professional analysis? HCI empowered by computer vision models can help! @Dakzen4 Check out the paper at https://t.co/ur1XlMKfuc to learn more.
Want to know when and how would a soccer team change their passes? Check out PassVizor, an interactive tool for analyzing the dynamics of pass. Paper: https://t.co/jMD0KNwi95 #ieeevis
Trying to apply causal analysis to your work? Causality Explorer allows users to interactively explore, validate, and apply data causality. Check out the paper at https://t.co/uuaW6eorHY to learn more. #ieeevis
What is the secret of winning for racquet sports players? The multivariate event sequence model can tell you the answer. Check out the paper at https://t.co/QBp8x26TvN. @yc_wu@zjuidg#ieeevis
How to create storyline visualizations in a more intelligent way? We introduce PlotThread that helps users create expressive storylines using reinforcement learning models. pdf: https://t.co/cwwSk8Qr75 @yc_wu@iTANG94@zjuidg#ieeevis
Data-GIFs are popular online, which embed visual messages in short animation and are played in loops. New work shows rich examples and design suggestions by @shuxinhuan Aoyu Wu, @JunxiuT@benjbach Yingcai Wu, Huamin Qu. See our website: https://t.co/ngyFc23Y9S #ieeevis
BNVA is a visual analytics system designed for the performance analysis and incremental planning of bus routes based on a pareto-optimal route generation model. Paper: https://t.co/mTRhGOLUVq @dw_vis@yc_wu@zjuidg#ieeevis
What is the secret behind the top table tennis players around the world? Tac-Simur will answer you! Available at https://t.co/VKRaS7sPwL @ZJUIDG#ieeevis