@robot2trade1 Where I differ: the asset is not any single hit, but Pop Mart’s ability to reallocate shelf space, formats and overseas rollout across IPs. In 1H26, THE MONSTERS fell 7.5% while five other artist IPs grew. The warning is inventory days rising to 201—not LABUBU fading alone.
@liqian_ren Agreed on the demand gap. But a cheaper alternative proves manufacturing efficiency, not yet a consumer-brand moat. The real test is whether a Chinese entrant can own design, distribution and repeat purchase while preserving margins after overseas acquisition and service costs.
@algotradingdesk The platform thesis is reasonable, but the figures appear inconsistent with Pop Mart’s 1H26 filing: group revenue grew 23.8%, not 200%+, while THE MONSTERS fell 7.5% to RMB4.45bn. The stronger evidence is IP rotation—not headline growth. What is the source for these numbers?
@investing_china Policy can scale visibility, but brand durability is harder. The real test is whether heritage converts into repeat purchase, pricing power and profitable distribution. Scale measures size; unit economics show whether a brand can compound.
@ChinaGSProject Brazil is strategically interesting, but store count is not the key evidence. Mixue’s overseas value depends on local unit economics: sales, payback, closures and whether supply density can sustain low prices. Until then, expansion is an option—not a proven growth engine.
Mixue (https://t.co/3gsyuV17br) still has a moat, but its growth engine is weakening.
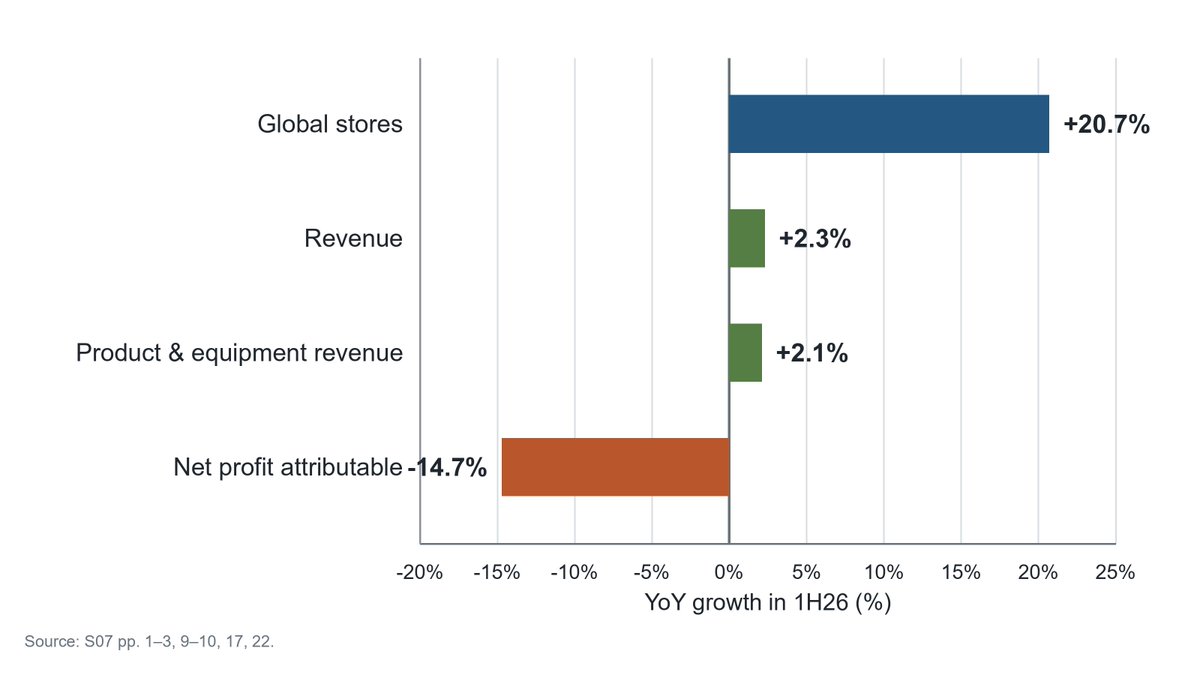
In 1H26, stores rose 20.7%, product/equipment revenue only 2.1%, and net profit fell 14.7%.
The next test is revenue and gross profit per franchise store—not how many stores open.
Inventory—not slower growth—is Pop Mart’s clearest bear signal.
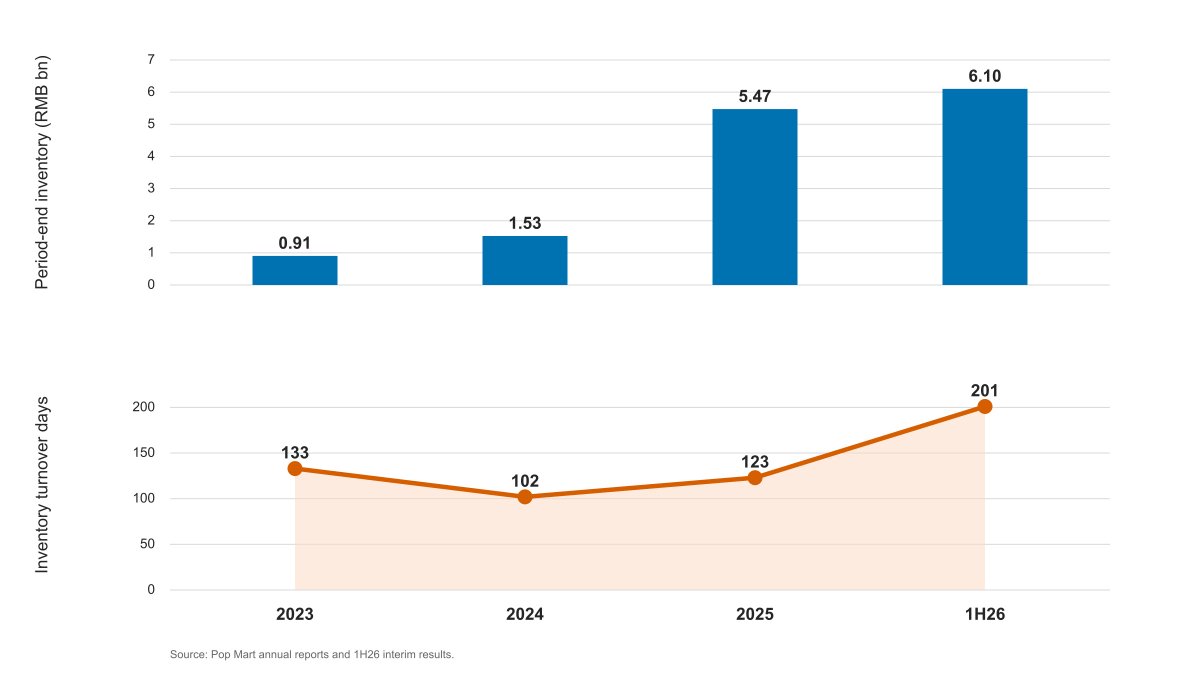
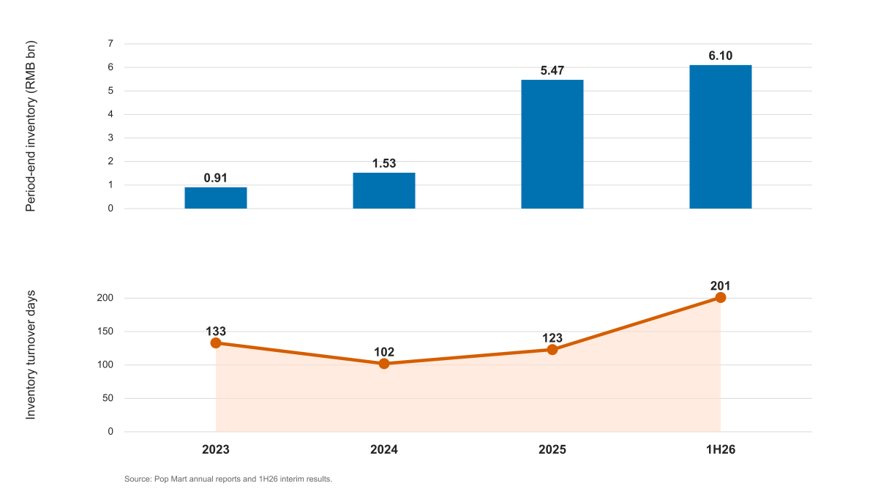
Inventory rose from RMB1.53bn to RMB6.10bn, while turnover days climbed from 102 to 201.
If this normalizes without impairments, the IP-platform thesis strengthens. If not, it remains hit-driven retail.
@business Slower topline growth is real, but the mix matters: THE MONSTERS fell 7.5% in 1H26 while Twinkle Twinkle rose 580.6%. The bull case is portfolio rotation; the bear case is that inventory days reached 201. The next test is overseas SSS and stock efficiency.
@yicaichina The buyback is secondary. The key question is whether 23.8% growth can coexist with inventory days rising from 123 to 201. If inventory normalizes without impairments while several IPs scale, the platform thesis strengthens; otherwise capital return does not fix the risk.
@vivilinsv@POPMARTGlobal Good framing. The key distinction is between repeat purchase driven by random assortments and repeat purchase driven by IP attachment. Pop Mart reports member repurchase near 50%, but not the split—important when judging durability beyond the blind-box mechanic.
9/9 Pop Mart is becoming an IP commercialization platform—but the thesis remains unproven. It fails if: (1) one IP dominates revenue; (2) inventory days and write-downs rise; or (3) overseas stores disappoint on same-store sales, payback and repeat purchase beyond leading IPs.
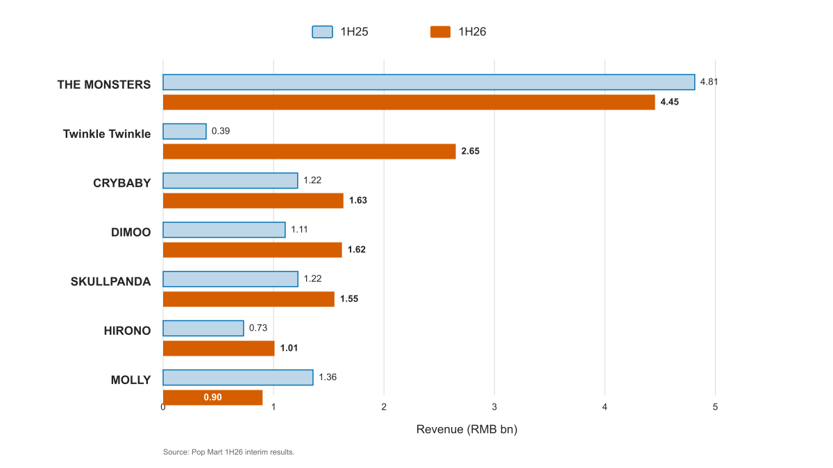
1/9 Pop Mart (HKEX: 9992) can look like a one-hit LABUBU story. Yet in 1H26, THE MONSTERS revenue fell 7.5% to RMB4.45bn, Twinkle Twinkle rose 580.6% to RMB2.65bn, and group revenue still grew 23.8%. Luck—or an emerging IP commercialization platform?
8/9 Inventory is the strongest counterevidence. It rose from RMB1.53bn at YE24 to RMB5.47bn at YE25 and RMB6.10bn at 1H26; reported inventory turnover days rose 102 → 123 → 201. If IP rotation needs ever more stock, the “platform” may still be fashion retail carrying hit risk.
7/9 The operating loop is IP → controlled distribution → sales feedback → resource reallocation → more formats and markets. At YE25, Pop Mart operated 630 stores and 2,637 roboshops across 20 countries. In FY25, wholesale and other channels accounted for just 4.7% of revenue.