We're kicking this twitter into high gear, just in time for summer! We've been hard at work upgrading our products and can't wait to show them off to you. Demos incoming. Check us out for awesome charts and grids!
#dataviz#Analytics#charts#chart
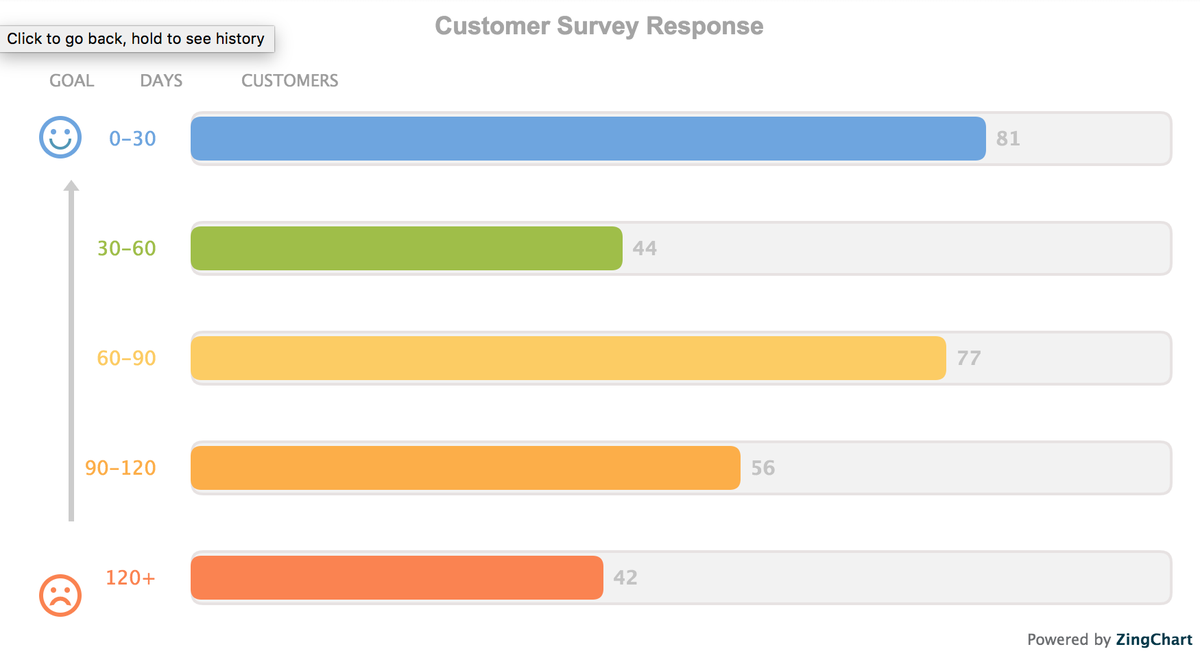
This #JavaScript chart may be overkill, but it does a good job of showing off many of the features that make ZingChart useful for web devs and their end users 🤓 Explore the details of this interactive #JS chart in our gallery 🖼 https://t.co/1E8n3ShUhd
#dataviz#analytics
🚀New ZingChart Release🚀
ZingChart v2.9.10 is here! New features available such as a new map, hoverEffect attribute, math operations support and several key bug fixes! Check out our changelogs for all the details!🙌 #dataviz#webdev#SaaS#javascript
https://t.co/bOWgbqggIQ
🤫How to Hide Context Menu Options🤫
In this blog post, we teach you how to hide the "View Data Table" option from the context menu as an example. Just a small piece of extensibility with ZingChart! 👊 #dataviz#javascript#webdevelopment#Tutorials
https://t.co/VLSSc1zzXs
✨New Tutorials✨
In this article we'll see how to get started with ZingChart and Svelte and look at tapping into some ZingChart features from within a Svelte app. We've written a wrapper to provide easy access!🙌 #dataviz#svelte#programming#Developer
https://t.co/7krVIjCiFJ
✨New Tutorials✨
ZingChart can be used in any web application, with or without a framework. Check out our new detailed article about using ZingChart with React 17! #dataviz#javascript#ReactJS#webdevelopment
https://t.co/YyvS7EYyic
👉New ZingChart Tutorial👈
Check out our new post below about how to extend your `zingchart-angular` wrapper Type Definition File to include your own properties on the chart configuration object.🙌#dataviz#webdevelopment#Analytics#DataScience#bigdata
https://t.co/fUf6k9O2rd
@rhlpnd89 Hi Rahul,
Thanks for reaching out! Do you mind taking this to our support channel? Please email your problem to [email protected] or start a chat on our site, https://t.co/hycgPJ31QJ.
- ZingSoft Team
Ever wish your pie #charts had a little more info to clarify your data? ZingChart has you covered with features like legends, labels, tooltips, and more! Curious to see what those features look like in action?
View demo 👉🏽 https://t.co/Itc4x7kkOf
#JavaScript#dataviz
Combine bar & stock #chart types 📊📈 to visualize composited financial market activity in one place using ZingChart's mixed charts feature 👋🏽
View the live demo ➡️ https://t.co/FD8MTqcrEN
#chartoftheday#dataviz#javascript#finance#infographic
Drilldown is a type of interactivity that can help lighten the information density of your charts. In this demo, we created a drilldown pie #chart that reveals a second level of information when a pie slice is clicked 👉🏽 https://t.co/S1RyqypQXS
#analytics#javascript#dataviz
Looking for a #dataviz library that will transform your #JavaScript gauge charts from Bad to Excellent? Look no further than ZingChart, we've got you covered 😎 View the live demo ➡️ https://t.co/192rz2vQtD
#infographic#webdev#chartoftheday
Visualize flows & connections in your #analytics data using ZingChart's chord chart type! In our live demo, we use a chord diagram to visualize call center escalation paths across major US cities in a sample data set 📞 https://t.co/2WHGN8Xzzc
#JavaScript#chartoftheday#dataviz
#ZingChart gives web devs many ways to visualize data in #JavaScript charts – even if they're using the less common #chart types! For example, this interactive vertical treemap features sample annual expenditure data within a country during a given year 💵 https://t.co/DjpTDONd7u