Often see folks talk about context(vague) - but not much about 'Contextual Filters' - so heres what Ive cobbled together over the years:
1. Location Context
VWAP proximity: Are large orders or absorption zones forming near VWAP? This often acts as a mean reversion magnet or balance point.
Session high/low: Is the DOM pattern forming near intraday extremes? Watch for traps, breakouts, or absorption.
Prior day’s high/low/close: These levels often attract algorithmic activity and institutional interest.
Key swing highs/lows or liquidity pools: Patterns at these spots carry more weight.
Opening range: Breakouts or defense of the ORH/ORL can set the tone for the session.
Something smells fishy
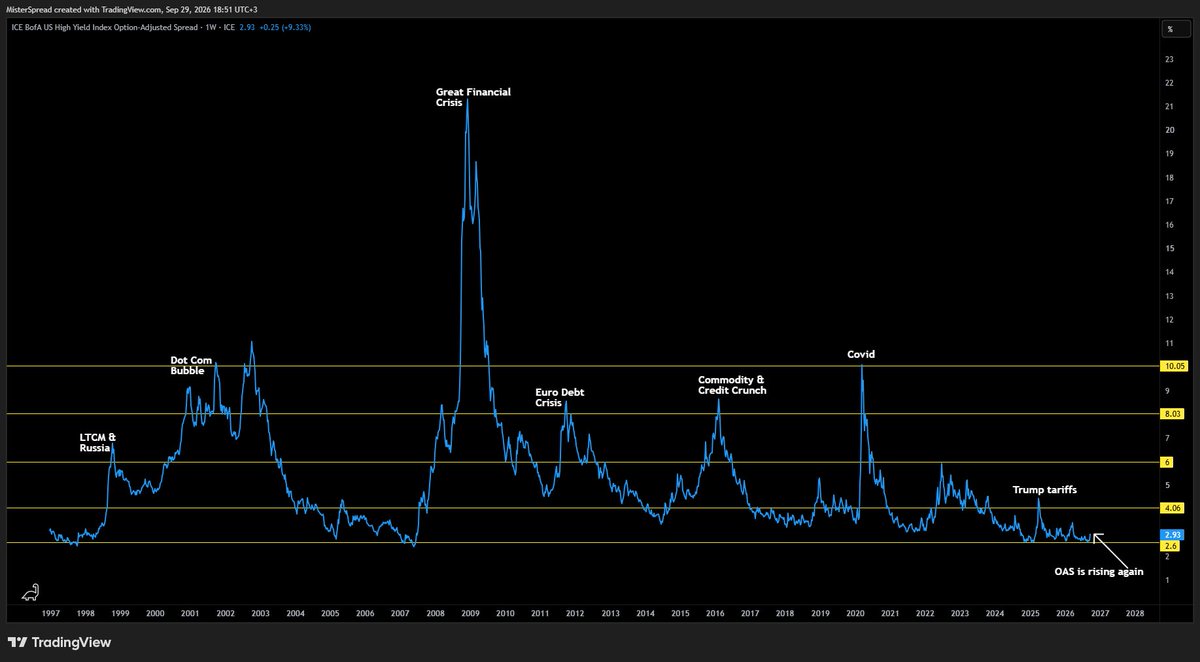
Here's why I think risk assets could come under pressure short to medium term, starting with credit:
ICE BofA US High Yield Index Option-Adjusted Spread (OAS)
Measures the extra yield investors demand to hold high-yield (junk) corporate bonds instead of US Treasuries. Shown in percentage points.
"Option-adjusted" means the spread is corrected for options built into the bonds, mainly issuers' right to call them back early, so it reflects credit risk only.
Why it matters:
Credit risk: A wider spread means investors want more compensation for default risk, usually because of economic uncertainty or weaker corporate balance sheets.
Economic signal: Spreads tend to widen ahead of and during downturns and tighten when confidence is high. Not every spike has led to a recession (1998, 2011, 2016), but every US recession since 1997 has come with a sharp widening.
Stress levels:
Below 3: Complacency, credit priced for perfection
Above 4: Watch
6: Elevated stress
8: High stress, recession risk
10+: Crisis
My take:
Spreads just jumped 25bps to 2.93%. We're still close to the lows, so this is a warning shot for now.
What I'm watching is a weekly close above 4%, that's where risk-off gets confirmed and 6% comes into view. Below it I stay alert but I'm not changing my positioning yet.
With spreads this tight, hedging is cheap, so it's worth thinking about protection now. 🫡
the monday sweep | episode 58
🎉WIN 500 USDT 🎉
i'll bet you that on october 19th, bitcoin is lower than $70,000
want to bet against me? to enter:
- follow me
- like and retweet this post
- comment on this post
winner will be picked at random on october 19th
good luck! 💪
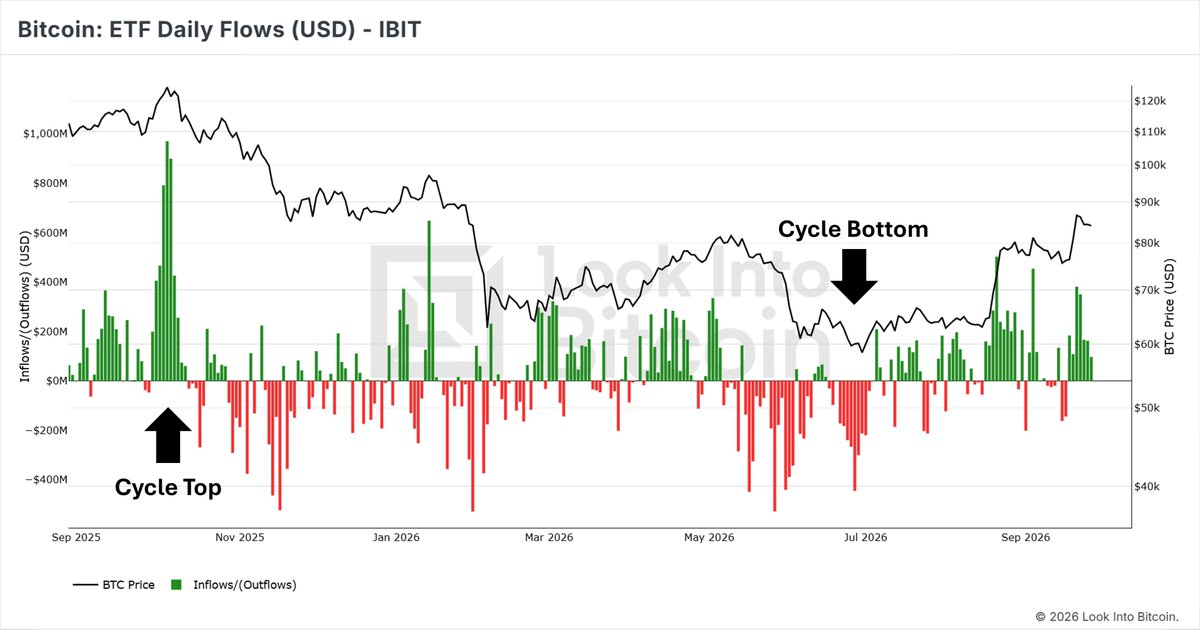
Bitcoin ETF flows are NOT a leading indicator.
I’ve said this for a long time, but now we finally have enough data to see it clearly.
Look at BlackRock’s IBIT:
🟢 Huge cluster of inflows at the cycle TOP
🔴 Huge cluster of outflows at the cycle BOTTOM
That’s not forecasting price, that’s reacting to price.
I think of ETF flows more like a tradfi Fear & Greed Index. They tell you how mainstream investors are feeling right now, not so much where Bitcoin is going next.
So when you see people on here getting excited because ETF inflows are surging and using that as evidence BTC must go higher...
Remember this chart.
I feel as though my timeline is divided on whether the bottom is in...
I'm not sure it really matters.
I think it's important not to become overly fixated on how much lower price could go without asking the inverse question... what if I'm not positioned, and what's the opportunity cost if the upside is significant?
For me, it's less about prediction and more about trade expression.
Define the risk... put on an appropriate position when the market gives you enough reason to do so... and let MGI dictate what happens next.
Add, reduce, exit or invalidate as the information changes.
You can have an opinion, be wrong about the eventual path and still make money...
Equally, you can make the correct macro call and extract very little from it.
I remember selling the top of the Bitcoin market in around the 6th of Oct - before 10/10, yet I never once claimed "the top is in."
You simply don't know that in real time.
What mattered was how I was positioned and how I responded to the information the market subsequently generated.
Having a view is useful... being able to express that view with clearly defined risk whilst retaining the flexibility to be wrong is what actually matters.
I guess I've done alright this cycle... sold the top and then flipped my view around the lows in July and been increasing spot exposure.
Hindsight looks great when it comes to fruition... but in all honesty, you never really know.
You just have to embrace uncertainty tbh as markets can turn at any point... and I've been through enough cycles to see just how quickly shit can really hit the fan and screw ppl over.
Ultimately it's the downside that catches most out due to complacency or greed.
Survive that... and you give yourself the opportunity to participate in everything that comes after.
$ETH
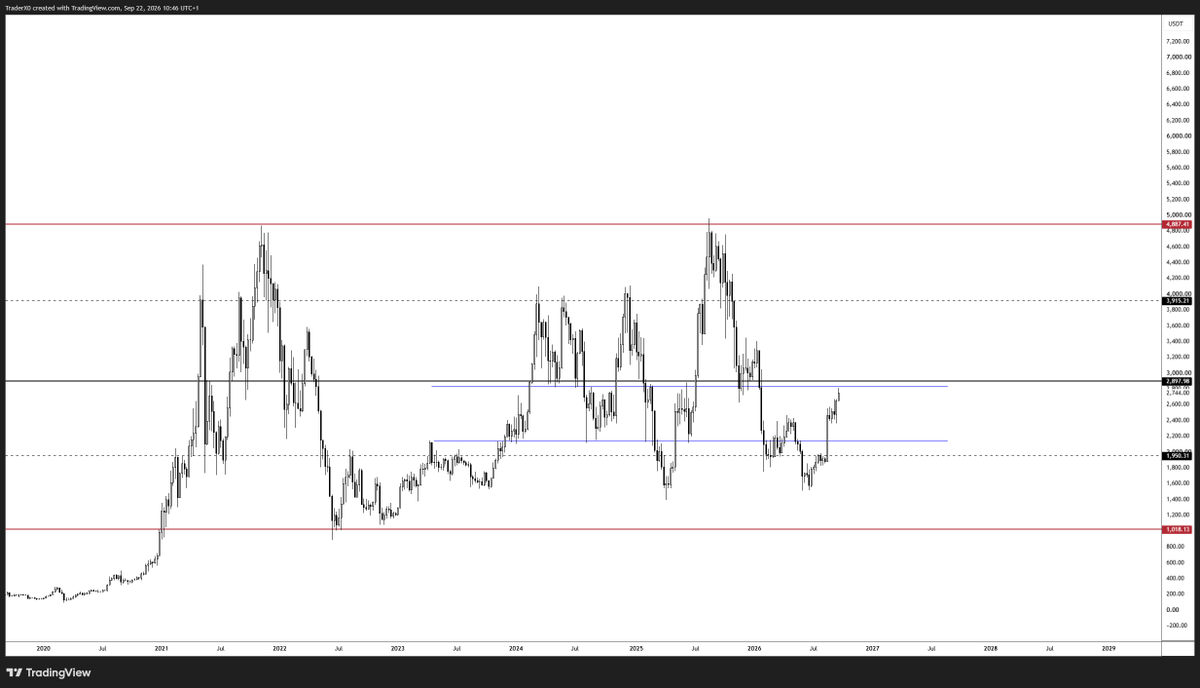
I think we're approaching an area of interest around the local range highs, see the blue levels.
Interested to see how price trades around Monday's high. If the right trigger develops, I'd be open to expressing a tactical short for a mean-reversion rotation over the coming weeks - if the trigger is there...
Not necessarily a bearish view... simply trading location, structure and the opportunity in front of me.
Spot remains largely unchanged - wanting to continue adding on meaningful pullbacks.
That's ultimately why I'm comfortable shifting tactically through perps... I can trade both sides of the shorter-term auction without having to over-trade the broader macro spot positioning.
Equities grow longer term, but they flip between periods of growth & stagflation
These periods are often inversely correlated with commodity bull runs & global uncertainty.
Equities have been growing for the past 18 years averaging an outsized CAGR return of 15%, which is above historical average of 10%.
At the end of these phases, people always think that periods like this will last forever because there is some technological revolution. Passive investing beats the active one & dumb money beat the best portfolio managers of the past decades.
But the market always comes back to the mean and we are nearing the end of this phase now (but the end phase can still last a while)
The #DecadeOfCommodities has clearly started as I outlined over the past years with #Gold breaking out in 2024 & Silver in 2025, soon to be followed by others as well. These periods last on average 15 years.
Looking at the Oil vs SPX & Gold vs SPX charts, it is clearly visible we are in an accumulation phase, also followed by the rising US 10 Year Yield market, which has also just recently broken out & continues to rise.
The period of hard times ends with a commodity and yield market blow-off top, followed by a period of equity growth again.
The GOLD/SPX pair already broken out. OIL/SPX is soon to do so.
These periods are also often marked with high deficit spending. The latest stimulus packages announced & deficit/GDP ratios entering a bull market further confirm the thesis.
We are entering a period in which active management in equities is gonna beat the passive one & where passive management in commodities will beat the active one.
@realdanielnita@cryptoggi Democratic au fost anulate primele alegeri. Procesul electoral a fost viciat in momentul in care cg a declarat 0(zero) bani investiți in alegeri, promovare. Problema e ca s-a așteptat mult pana sa se anuleze, in loc sa fie anulate din prima secunda cand s-au descoperit neregulile
Auction Context – Market Profile as Your Map
Before you think about placing a trade, you want to know where in the auction cycle the market is.
Market Profile gives you the structure that most traders don’t see when they’re staring at candlesticks.
5 Core Concepts to Track:
1. Value Area High (VAH) / Value Area Low (VAL)
Defines the 70% of the session’s volume where most business was done.
Outside of value = “expensive” or “cheap” to the market participants.
2. Point of Control (POC)
Price with the most activity = a magnet in balance conditions.
3. Main Day Type Recognition (there are others)
3.1 Balanced -> Mean reversion more likely.
3.2Trend Day -> Initiative activity dominates which means profile elongates in one direction.
3.3 Double Distribution → Two distinct value zones; mid-point acts as a pivot.
4. Structural References
Single prints, low-volume nodes (LVNs) and (HVNs), poor highs/lows, unfinished auctions, each can act as magnets or barriers.
5. Why this matters:
Knowing the auction context lets you pre-define where business is likely to occur and where rejections are probable = which stops you from chasing every micro move.
NOW ONTO GAME PLAN:
Auction context feeds into your game plan.
You’re answering the following:
“Am I a buyer, seller, or observer today?”
“Where is my line in the sand?”
Premarket Prep Routine:
- Mark prior session VAH, VAL, POC.
- Mark overnight high/low and see how they relate to prior value.
- Note anomalies (e.g., single prints) that could be filled.
Decide if you’re looking for:
Initiative trades (price driving away from value) ?
Responsive trades (price returning to value) ?
Bias Examples:
Open above VAH + holding → Look for longs if order flow supports continuation.
Open inside prior value → Fade moves to VAH or VAL unless initiative order flow breaks out.
Mindset:
You should be able to write your bias in one sentence before the open. If you can’t, you’re not ready to trade.
Anyway just my 1 cent whilst Im watching a trade develop - cheers
🚨GIVEAWAY🚨
we're giving away 5 x $5000 challenges with Hyrotrader
entering takes less than 30 seconds
- follow me and @hyrotrader_com
- retweet and like this post
- comment below
AND join discord: https://t.co/LVaa8rLboO
i'll pick the winners from random on saturday
@MisterSpread I know there are good players that don’t play for Real Madrid and as a fan of Ronaldo I was disappointed of his performance in this World Cup. As a fan of someone doesn’t means that I’m against everyone else or that person is a god for me that doesn’t make mistakes
@MisterSpread If France didn’t played against Spain I would have not been “against” them but I was a supporter of France from the beginning. And Argentina game from this night was just another game to watch for me like every game that Spain had, for one exception