Options Trader. All the technical & fundamental analysis I post are a personal opinion and not a financial advice. I don't post analysis anywhere else but here.
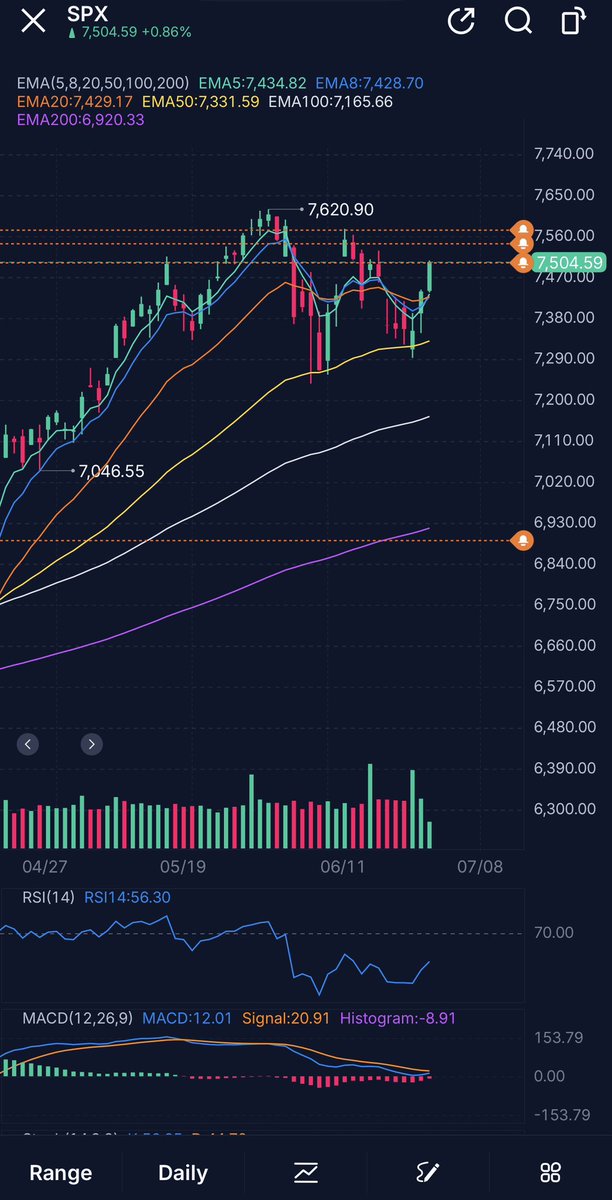
$SPY $SPX The macd on the daily points to a bullish July. If a dip comes it will be bought. New all time highs should be a matter of time. Summer is a low volume bullish season in the market so it makes sense.
I’m seeing reports from Bank of America that they are expecting a correction in the summer. I honestly don’t buy it and I think they are wrong.
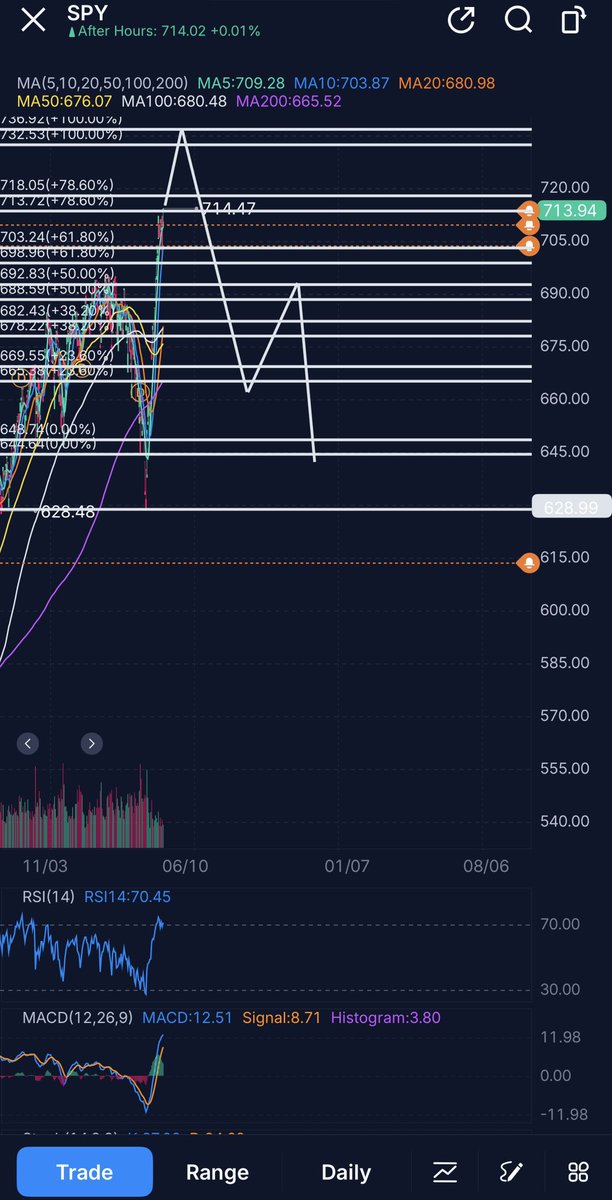
$SPY Hope you all had a great weekend. Here are the paths price can take from here. The lines drawn don’t mean price should go in a straight line up or down, it’s just to help visualise the moves.
It’s definitely a tough market to navigate right now (unless you close your eyes and buy calls anyway).
1) That’s the most probable and realistic path. Price needs to reject 713-718 and start correcting towards 690 or slightly lower, then go back up to make a new all time high at 730-732 or higher. Technically, even if price extends the correction to 660 it’s still a buyable dip.
2) Another very likely path. Price rejects 713-718, finds support in the 680s or a bit lower and bounces off hard, but only to make a lower high at 698-703 before rolling over. That’ll be very bearish and risks visiting the March lows.
3) This path is a lot less likely than the previous two but it’s still possible. Price breaks through the 713-718 resistance without a pull back and goes straight to 732-736. Price will then reject there and correct in a very harsh and fast way to the 680s or lower, then eventually finds support above the 200 dma and make a new all time high.
4) That’s the least likely path right now but I will definitely consider it and keep it in mind. We continue a blow off top towards 732-736 without a meaningful pullback, then lights out. An extreme non stop selling wave comes with small bounces in between all the way back to March lows, or lower. The least likely scenarios have been the ones playing out recently so don’t sleep on it.
It’s too early to tell which one will end up playing out. I will have to take it one level at a time. It’s good however to keep these scenarios in your heads and on your charts to know how to react around each level (If this, then that).
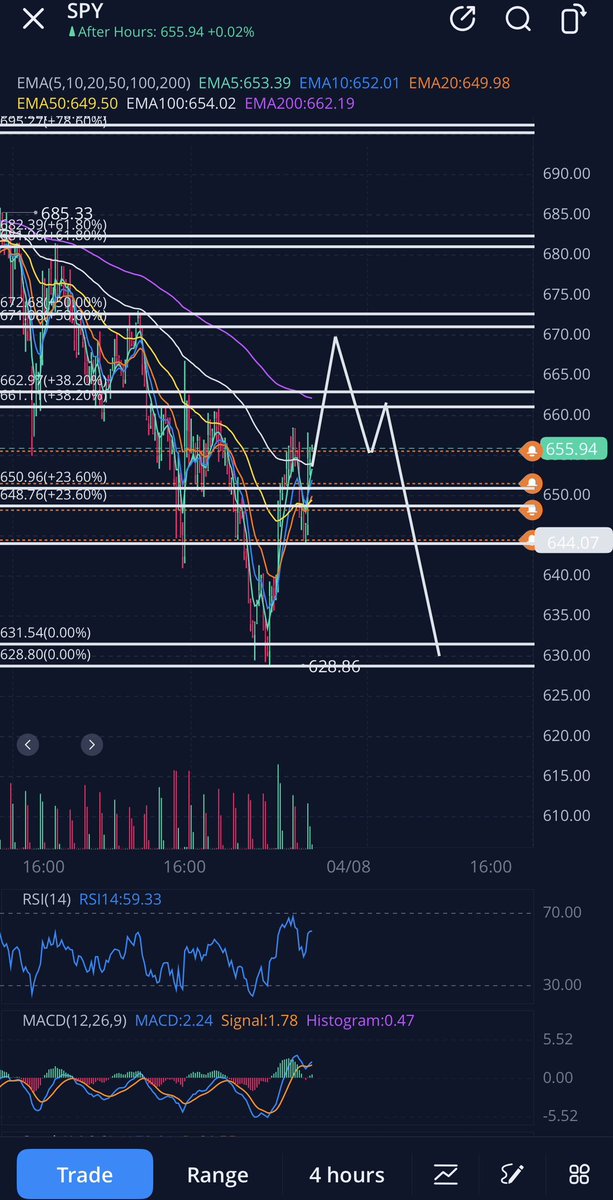
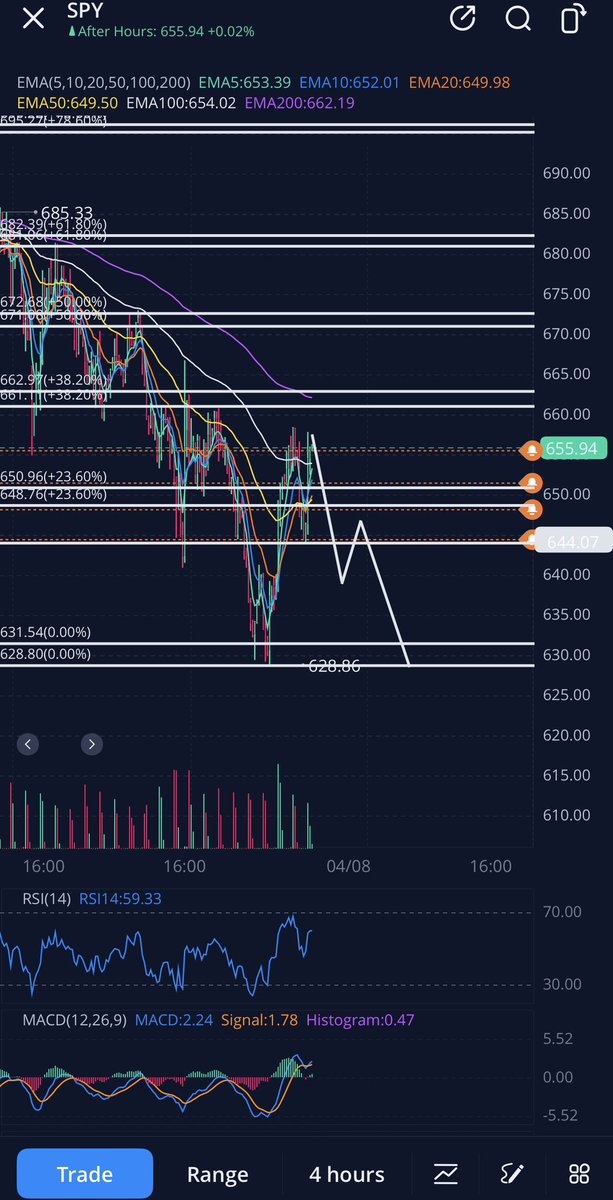
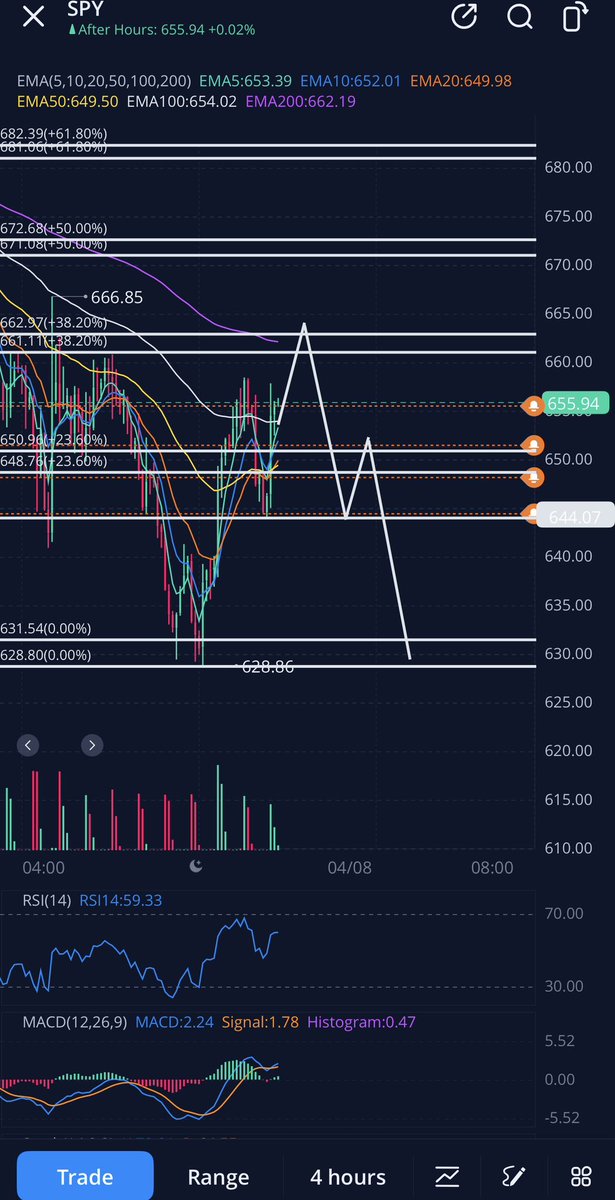
$SPY 3 different routes, one ultimate destination. That’s how I see the price action for the next 2-4 weeks.
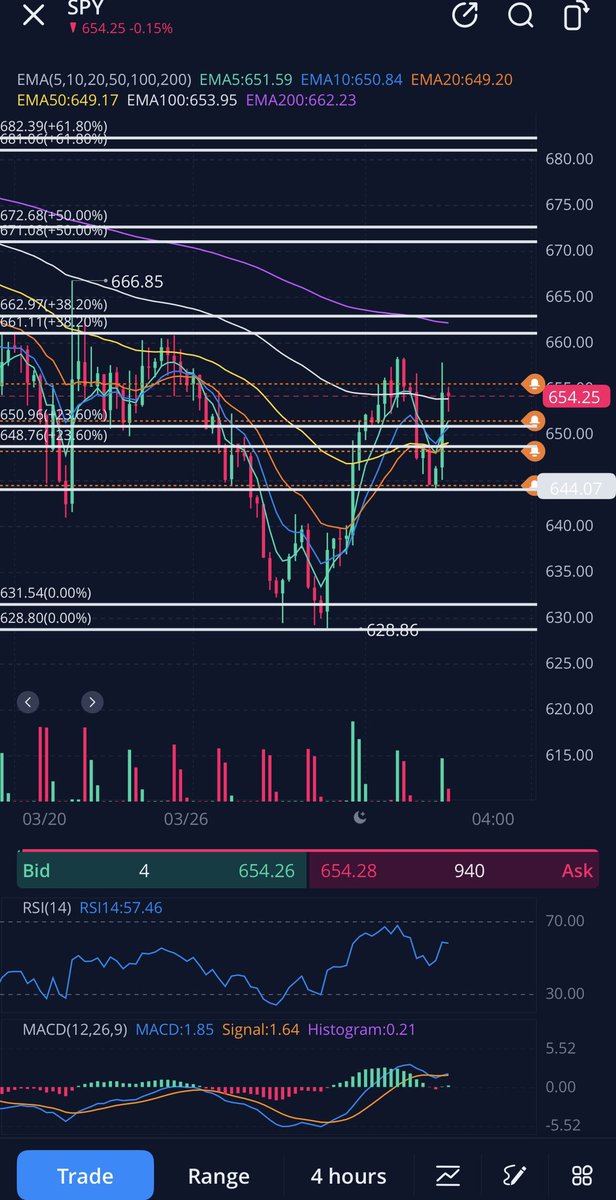
1- A move up towards 660-663, followed by a move down all the way to 631 minimum.
2- A stronger move up towards 666-672, followed by a move down all the way to 631 minimum.
3- No more room for a move up and the path to 631 minimum starts immediately from here.
Obviously the drop to 631 doesn’t necessarily have to be in a straight line, wherever it starts going down, although that’s possible, for sure.
$SPY Good morning. Not much has changed since what I wrote yesterday in the post below. The plan is still the same, read it again if you need to. You can also go to my pinned post for more guidance. Let’s see what today brings.
$SPY That’s very true. It’s actually a lot more common than people think as well.
When you have long winning streaks your ego inflates, you get greedy and you start to size bigger than you should. You may get more wins so you start sizing even bigger to the point where you full port, because why not ? You’re right all the time, aren’t you ?
The irony is that the full port trade more often than not is the one that misses, you then get emotional and don’t cut your losses or even try to manage the position until it’s too late.
Risk management is everything in this industry or else you’re gambling.
$SPY He’s right. Some smart ass will come and say to him “But they don’t always go opposite to each other” like that smart ass that tried to do that with me last week, he watches my content a lot although i don’t care about him. He knows himself.
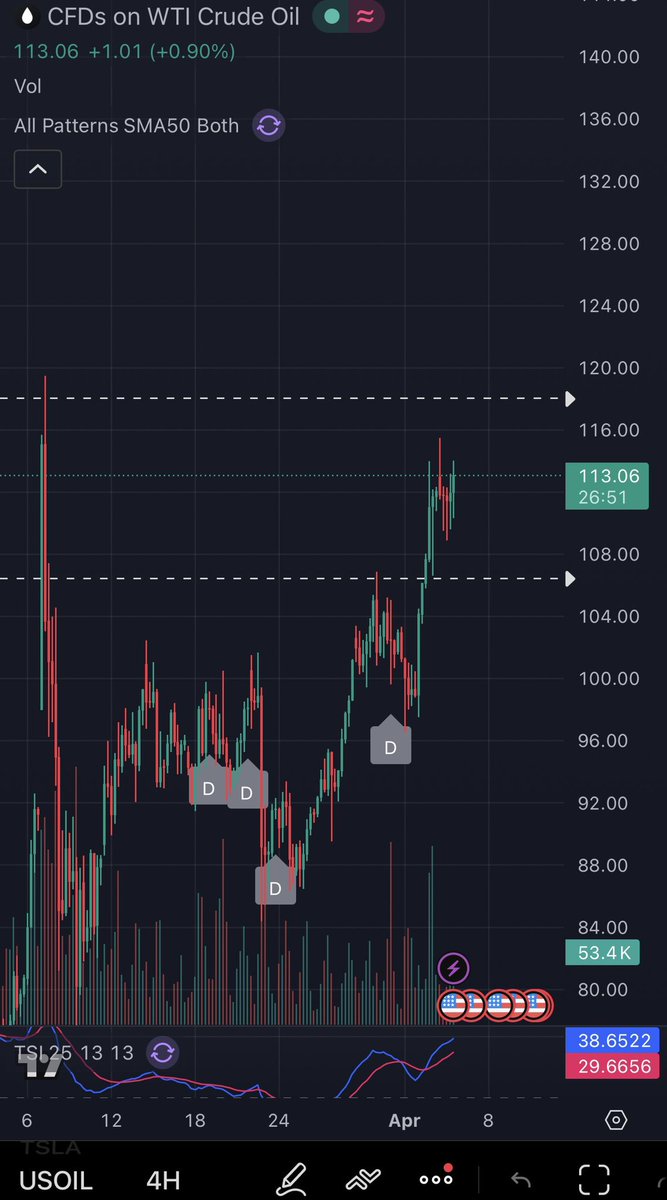
Listen smart asses, we know they don’t always go opposite but since the war began they do. The fact that we have to explain this to these people is beyond hilarious.
$SPY I’ll share this response because I think many here need to see it. Fintwit doesn’t move the market. I’m really in shock that some people actively trade with real money are thinking this. Whether the next major move is up or down, it won’t have anything to do with fintwit sentiment.
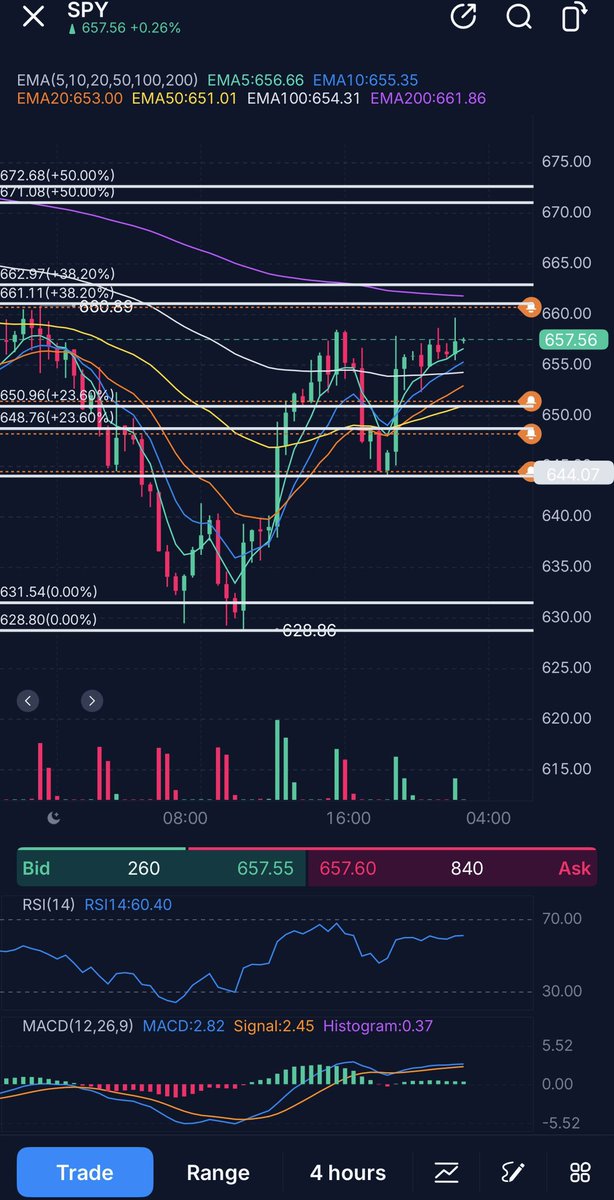
$SPY If oil pulls back to 107-105 to make a higher low, then spy will push towards 662 or higher to make a lower high. That’s where I’ll add to my puts.
If oil holds the bull flag and breaks out higher then spy should start breaking down from here.
I’m well positioned in my May puts for either outcomes and chilling. Price can take different paths but will ultimately reach the destination I’m aiming for, 631 🎯.
Holding above 672 is the only scenario where I see myself being wrong on the timing. It’ll mean another push towards 682 will come before going for new lows. Holding above 682 favours ATHs. This is clearly unlikely in my opinion and I’m not positioned for this, but I just want to share the invalidation levels too.
$SPY Good morning. Below is a reminder of the different paths I think price can take to reach the same destination.
I won’t do much today other than switching from 650 p May 1st to 650 May 15. I’ll scale in with only half here and I’ll add more near 661-662 or higher.
Some moving average facts about SPY that aren’t too good.
1. Eleven sessions holding below the 200DMA.
2. Over 5 weeks below the 21 EMA.
3. 20 DMA below the 200DMA by $3+.
4. The 50 DMA is hurtling toward the 200DMA & a cross would increase the risk of a price collapse to below $613 (Feb 19, 2025 top).
Algos aren’t stupid. They react to the moving average ensemble. It’s almost self-fulfilling. 💯
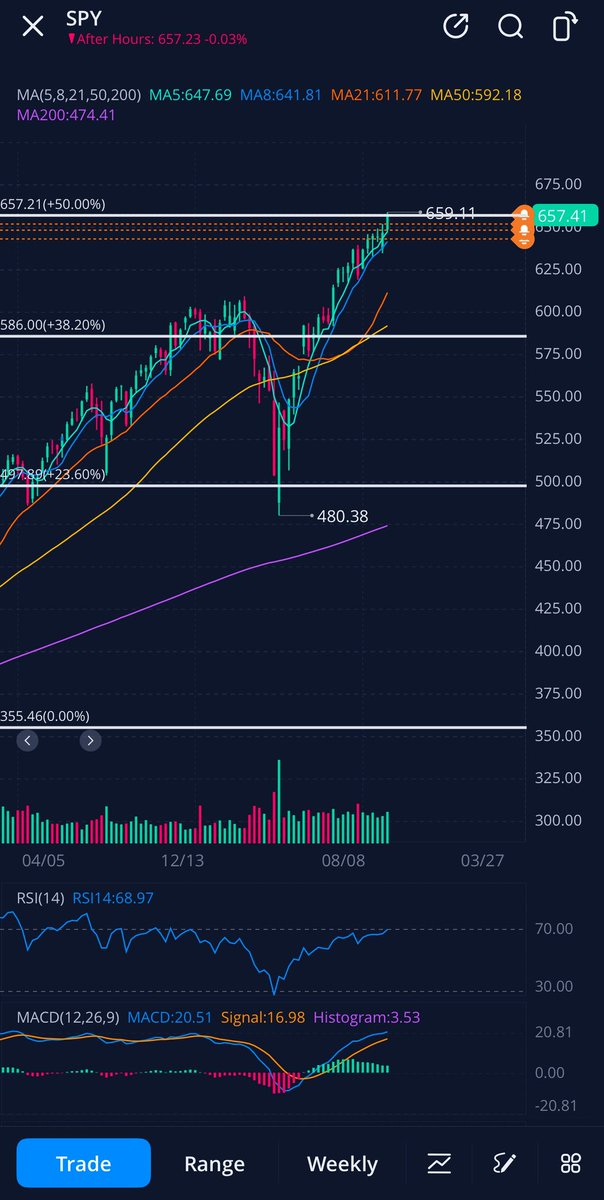
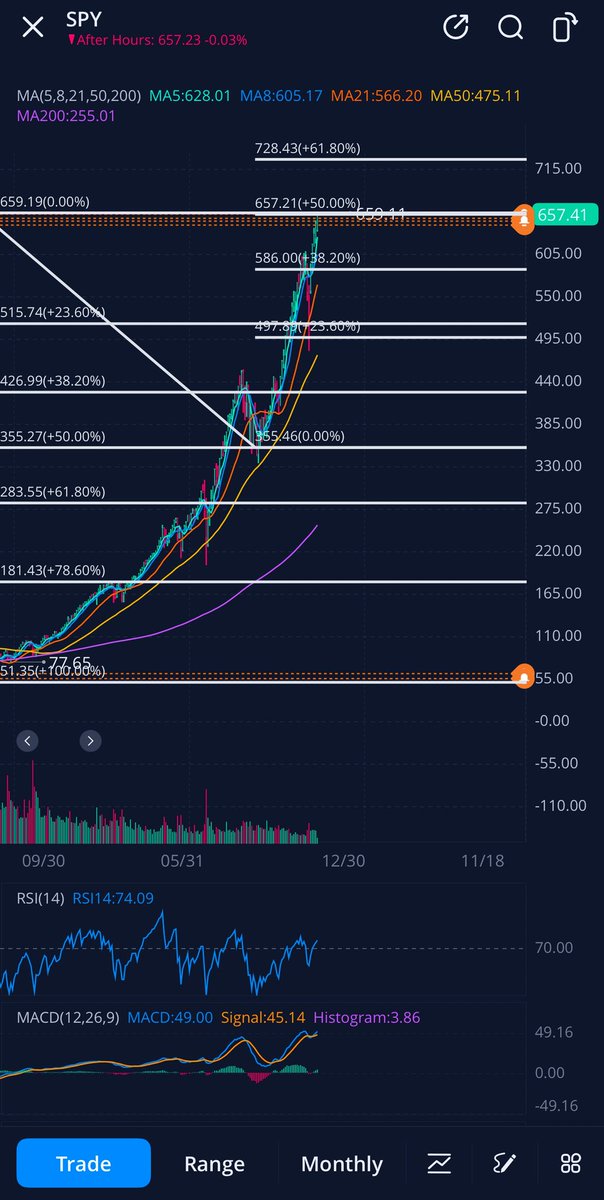
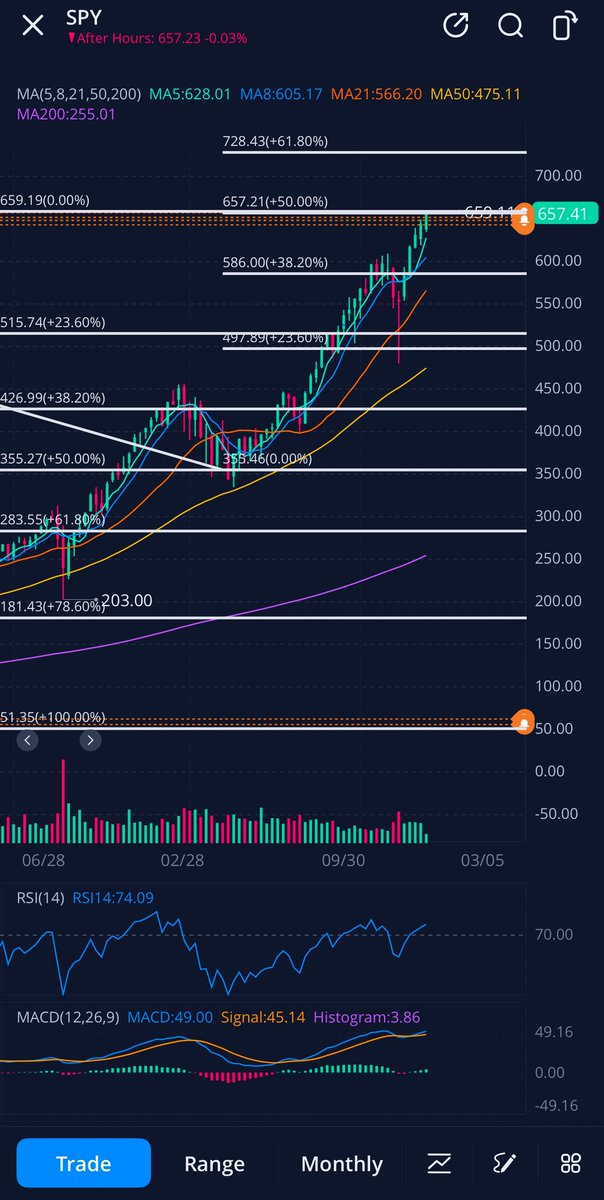
$SPY From a technical standpoint, all signals are flashing red, and not just on one timeframe. We currently have bearish RSI divergences on the daily, weekly, and monthly charts. This kind of triple divergence is extremely rare and historically has preceded major market tops. Price has continued to climb while momentum is weakening across all timeframes, a classic sign of exhaustion.
If you zoom out to the monthly chart, the picture becomes even more compelling. We’re sitting right around 657, which is the 50% Fibonacci extension drawn from the 2008 Global Financial Crisis bottom, a level that often behaves as a golden resistance zone in macro bull markets. Historically, during a healthy bull cycle, pullbacks tend to respect the 21-monthly moving average. But once a market enters full bear territory, those corrections deepen into the 50-monthly moving average. $SPY hasn’t touched the 50MA since the COVID crash. It almost did at the end of the 2022 bear market. If this rally fails to hold, that could be the next gravitational pull. I think we are currently in a topping process.
Now, can we grind a little higher? Sure. Technically, $665-$666 could be the final squeeze zone. And if we blow past that in a blow-off top, then the last line in the sand is at the 61.8% Fibonacci extension at $728, which is still visible on the chart.
What makes this even more critical is the macro backdrop. We’re in stagflation territory. Inflation is creeping back up due to tariffs and supply shocks, unemployment is rising, the jobs market is deteriorating, and banks are deeply exposed. This is not the environment for continued risk-on behavior. The Fed is cornered, and even if Powell softens his tone, it may be too late. Liquidity is drying, credit is tightening, and consumer resilience is cracking.
All the signs, technical, macro, and sentiment, suggest this is the turning point. Whether the fall starts now or squeezes one last time to 720s before falling, I believe we are witnessing the end of a full market cycle. I’ll pin the post until the thesis play out.
I shared a post about Warren Buffett earlier this week & the most bizarre aspect was several younger folks mocking him on my thread. Buffet is worth 12 figures & yet remained an approachable & common sense person his whole life. My take is, when you earn 12 figures over 78 years of investment experience then throw the pot shots. I will always have the deepest respect for the goat 🐐 of Omaha.
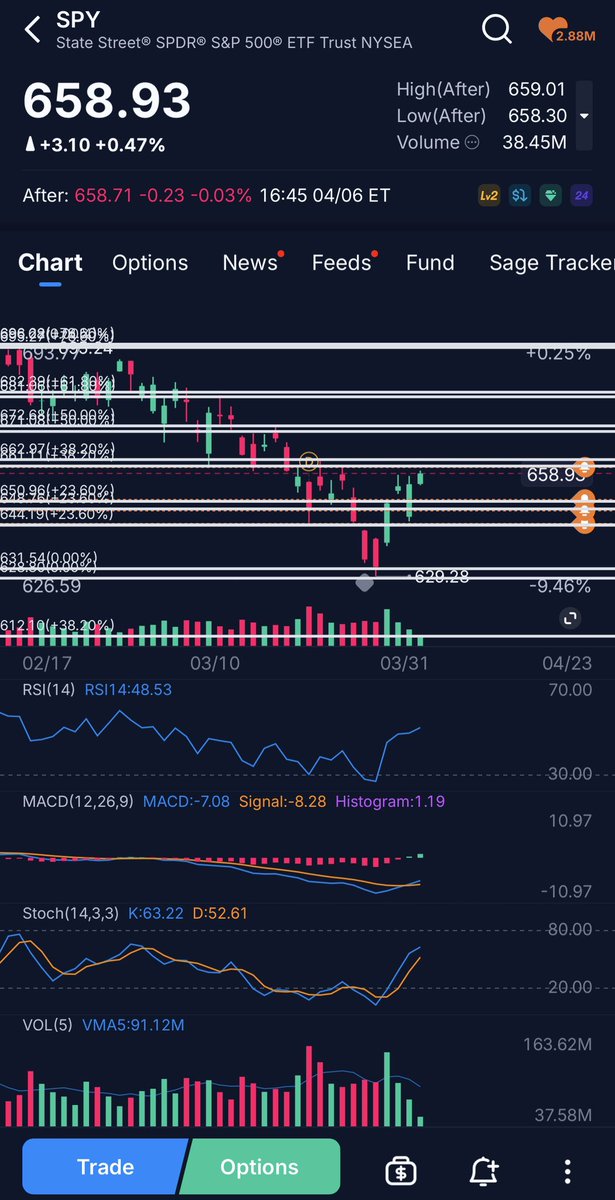
$SPY Very very tough set up to trade, at least for me right now.
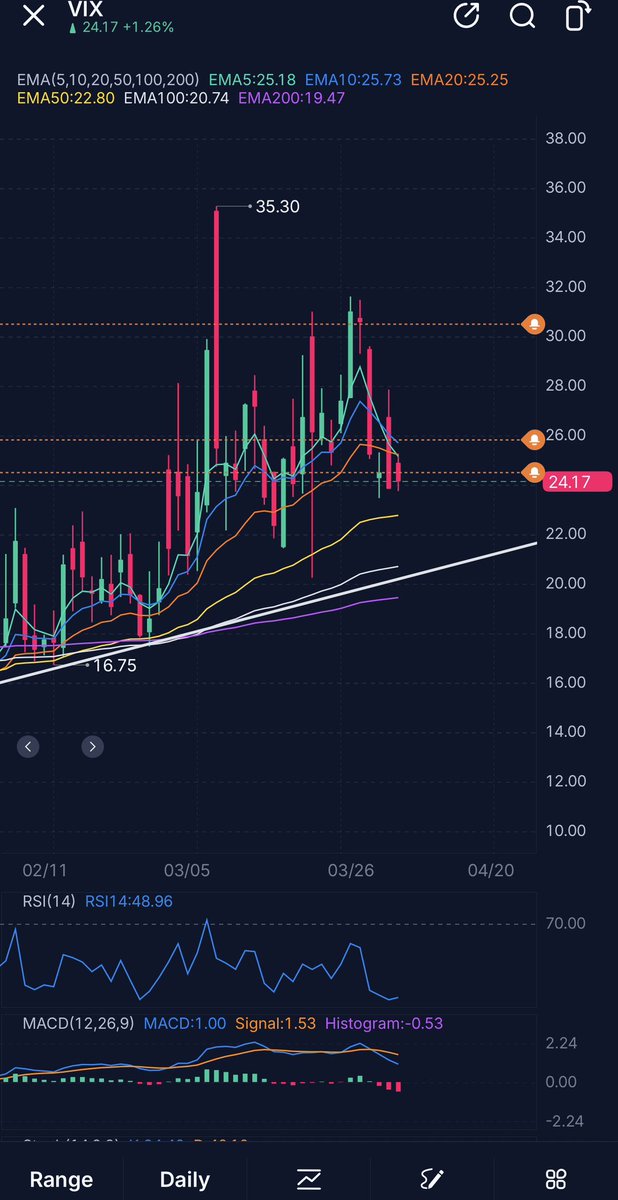
Oil is screaming that the market should tank. The volume on the pump is weak too. But the price action says it wants 661-662 or higher before making the new low. Maybe oil pulls back to $106-$105 to make a higher low, while spy goes up to touch the resistance before falling. It makes sense.
I think the safest way to handle this is to sell half of my puts at the close and leave the other half to swing. If the market pumps towards the 662 resistance or higher on Monday I’ll add the other half, and if we tank to make new lows right away from here I’ll still get to profit beautifully from the puts I’ll keep.
I don’t see a better way to go about this right now to be honest.
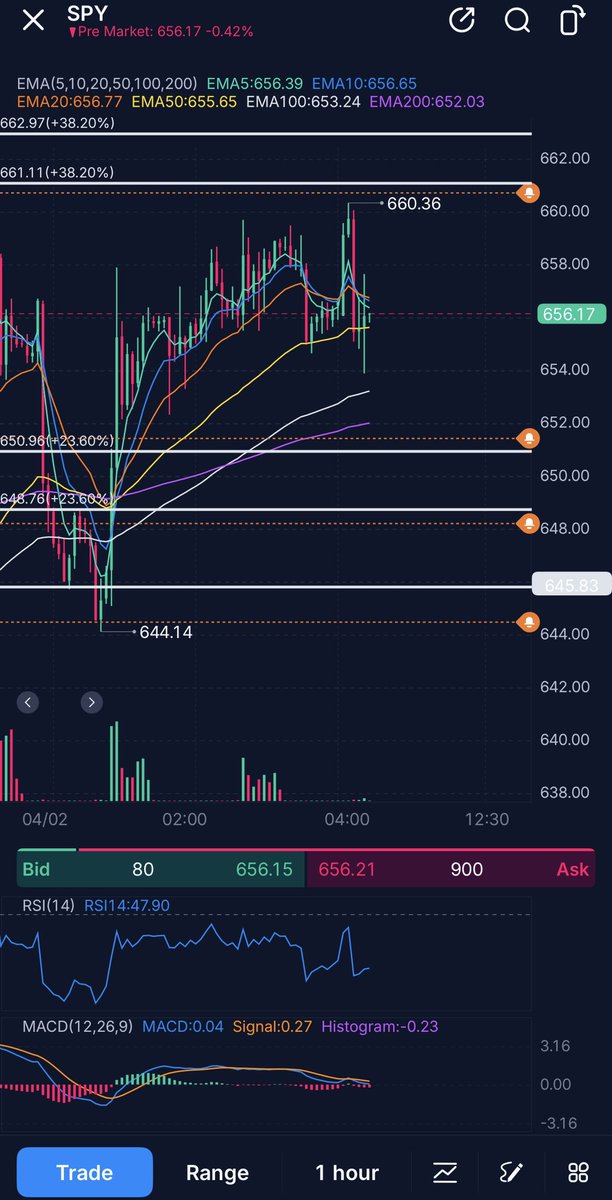
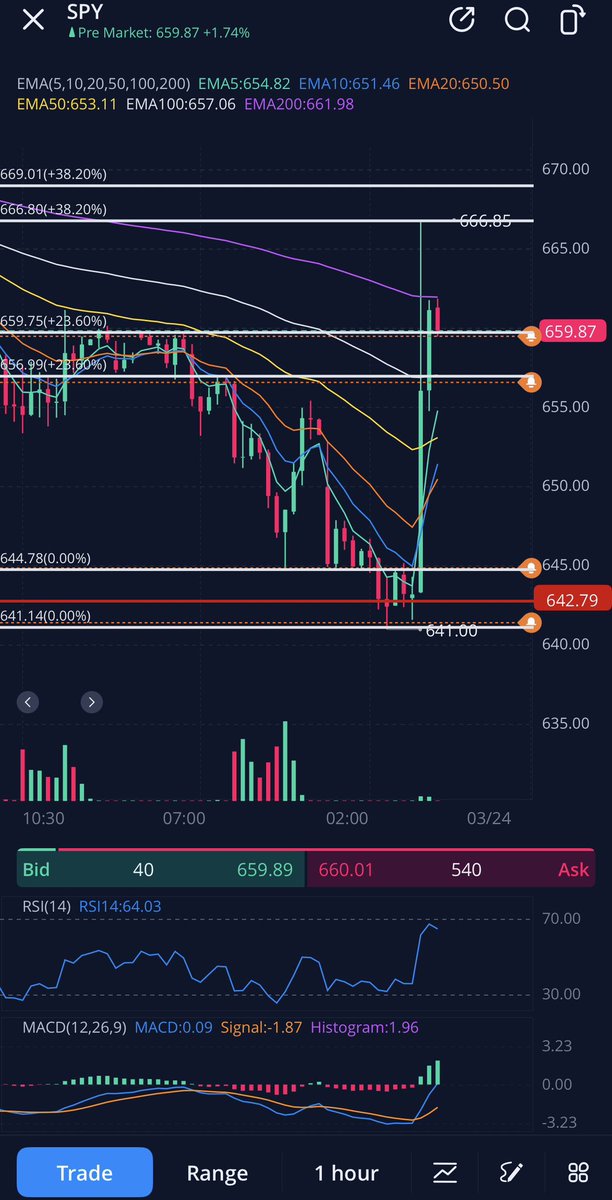
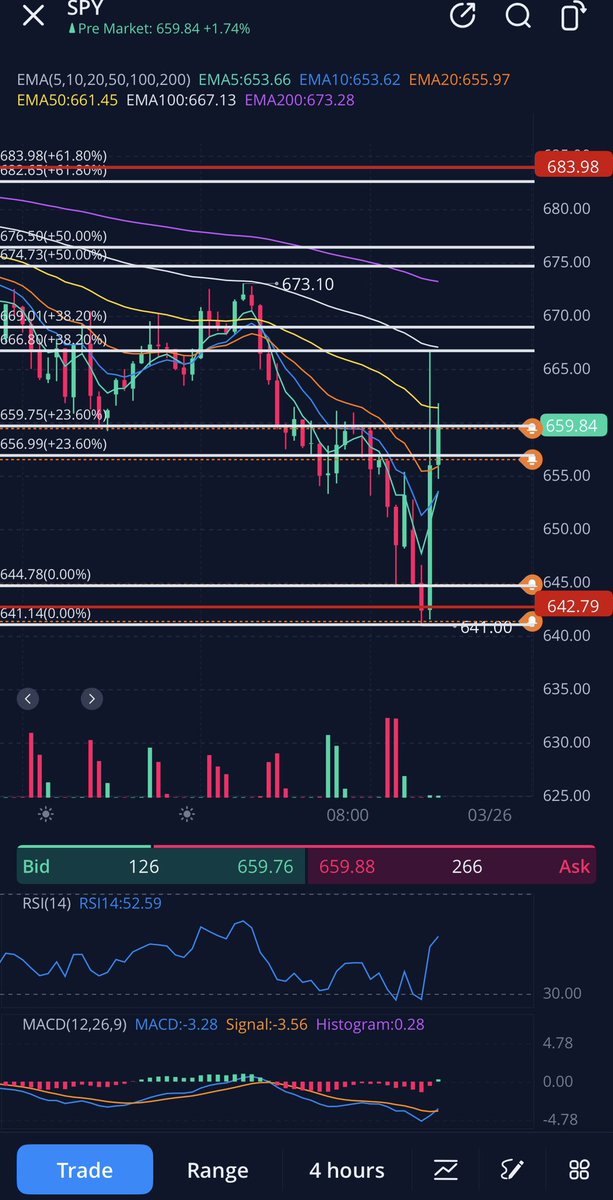
$SPY I’m targeting 662 for the trade so I’ll sell my calls if we open at 661 or higher. If we open lower and star retracing back I’ll hold, and I’ll be looking at 656-655 to be the first support. I have time on my calls so if you have short dated ones you shouldn’t copy me.
I wanted to add the remaining 40% of my calls position at 642 but i clearly won’t be able to now. I’ll still print hard with what I have if we hit the target anyway. The target technically hit, just not in a live session yet. You know what I mean.
I told you we’ll go below Friday’s low to test 642-640 before bouncing. And I also told you 642-640 won’t be easy to break at all. Even when the news hit price found resistance exactly where it should based on the levels on the chart.