My view on trading 📈
Some people ask for daytrading tips, but here’s my take:
I don’t chase every candle or stare at micro-charts. I focus on weekly/monthly setups that spark major moves.
I spot macro trend reversals so I trade less, profit more.
Time is our most valuable asset, so I refuse to be glued to the screen 24/7.
🎯 My mission: Build freedom, not another 9–5.
⚡ Trade smarter, not harder: Spot the macro trends that matter.
Ready to catch the next big wave? 🌊
#CrypFlow #Crypto #FinancialFreedom
@MaksimXBT Agreed. The post wasn't about the Stoch RSI cross in isolation.
It's the combination of structure, RSI behavior and cycle positioning that I'm comparing to 2022.
$SOL (1W) - Copying previous cycle
Back in March, I pointed out that the structure was starting to look very similar to the one that formed before the 2022 cycle bottom:
1. RSI breaking its downtrend
2. Bullish Stoch RSI cross
And just like previous cycle SOL got rejected on this first bounce.
If the pattern continues there is still more downside to come.
But here's the interesting part..
We're now entering the discount zone between $76 and $44 that I highlighted back then.
If history rhymes, this is where longer-term opportunities start appearing.
The question is:
Will SOL find support in this zone...
Or does it need one final flush before the next major wave begins?
$SOL (1W) - The same setup appeared before the last cycle bottom
Before the 2022 bottom, Solana printed a similar momentum structure:
🔹RSI breaking its downtrend
🔹Stoch RSI bullish cross in oversold territory
But the market didn’t bottom immediately.
SOL got rejected after a relief bounce and still moved lower before the final cycle low formed.
Now look at the current structure.
RSI is once again attempting to break its downtrend while Stoch RSI prints another bullish cross.
Market structure also looking very similar.
The key question:
Is the bottom already in…
or will SOL first revisit the discount zone between $76 and $44?
That area could become an important accumulation zone if history rhymes.
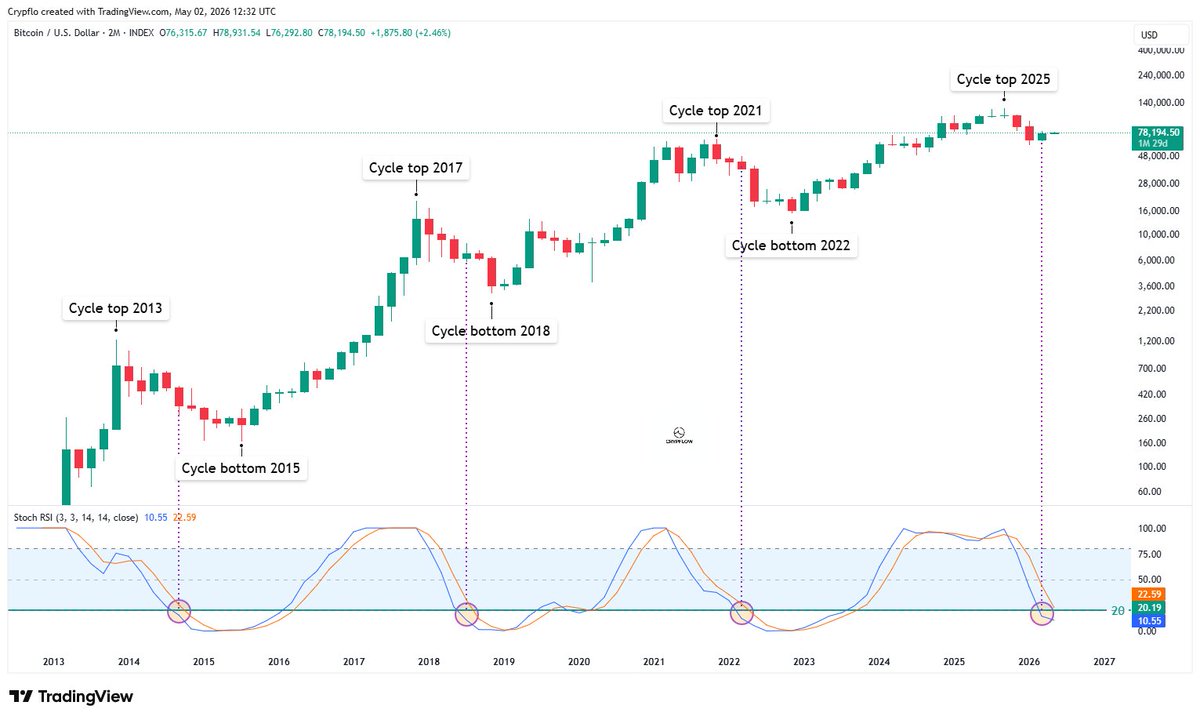
$BTC (1M) - Will the simulation continue?
Every prior Bitcoin cycle followed this pattern:
~1 year down
~3 years up
But here's the interesting part.
The timing was almost identical every cycle:
- Bottom → Top = 35 months
- Bottom → Bottom = 47 months
Not once.
Not twice.
Three cycles in a row.
If that rhythm continues, October 2026 would be the most likely window for the next cycle bottom.
Of course, history never repeats perfectly.
But after seeing the same pattern play out for over a decade, it's hard to ignore.
$BTC (2M) - The reason I stayed cautious.
Back on May 2nd, I shared this chart.
At the time, I was actually starting to lean bullish again.
Bitcoin had reclaimed the downtrend.
The Wave Trend had reclaimed -14.
And the market was showing the first signs of a potential reversal.
But there was one thing that kept me cautious:
The 2M Stochastic RSI was sitting below 20.
Historically, every time that happened...
more downside was next.
That's why I said it was my biggest reason for caution.
A few weeks later:
❌ The weekly Stoch RSI confirmed bearish
❌ BTC lost 74K
And now we're testing the exact area where that warning starts to matter.
This is why I always pay attention to higher timeframes.
Sometimes a single chart can outweigh ten bullish ones.
$BTC (2M)
Every single time the 2M Stoch RSI has gone below 20 in past cycles, the real cycle bottom was still ahead.
We’re sitting just below 20 again right now.
This is my biggest reason for caution.
$BTC (1W) - One signal left... and now it's gone.
On May 13th I shared this chart.
At the time, Bitcoin had already completed 2 of the 3 confirmations that marked previous bear market reversals:
✅ Reclaimed -14 on the Wave Trend
✅ Broke the multi-month downtrend
❌ Reclaim the 50 SMA
Now here's what happened next:
Bitcoin failed to reclaim the 50 SMA.
And more importantly...
The Wave Trend lost the -14 level again.
In previous cycles, reclaiming -14 was one of the earliest signs that the bear market was ending.
Losing it again tells us the reversal attempt failed.
We saw it happen in the previous cycle as well. (red arrow)
That's why I always focus on confirmation rather than prediction.
The market was trying to reverse.
The market failed and needed more time.
$BTC (1W) - One signal left.
Every previous cycle, Bitcoin needed 3 things to transition from a bear market back into a bullish environment:
→ reclaim -14 on the wave trend
→ break the long-term downtrend
→ reclaim the 50 SMA
Right now, 2 out of 3 already happened.
1. The wave trend reclaimed -14 again.
2. BTC broke back above the multi-month downtrend.
That’s exactly how previous cycle reversals started building.
Now only one major confirmation is left:
the 50 SMA.
And historically… after reclaiming the 50 SMA, Bitcoin never made a lower low again.
One signal left.
$BTC (1W) - Back in the DCA zone.
Bitcoin is back below the weekly 200 EMA.
Fear is rising.
Sentiment is deteriorating.
But my view hasn't changed.
Historically, losing the weekly 200 EMA has often been painful in the short term...
but it has also marked the best long-term accumulation zones of the cycle.
$BTC (1M) - Bitcoin is back at the channel.
A month ago I shared this long-term channel that has guided Bitcoin for years.
Every major turning point respected this structure.
Now Bitcoin is back at the lower boundary once again.
If this channel continues to hold, it could become the foundation for the next major move higher.
The bigger picture hasn't changed.
What do you think? Will it hold?
$BTC (1M) - this is the structure that has guided Bitcoin for years.
Bitcoin has been moving inside the same macro channel for years.
And every cycle keeps respecting it:
2017 → top of the channel
2021 → top of the channel
2025 → midline rejection
Momentum is clearly slowing and less parabolic.
On the downside:
2019 → support
2020 crash → support
2022 → support
Every cycle bottom has formed at the lower boundary of this channel.
This time, price bounced before reaching it.
If the structure continues →
that level hasn’t been tested yet this cycle.
The same channel also maps out where a potential top could form:
Midline → ~200K
Top of the channel → ~500K
This is the bigger picture most people miss.
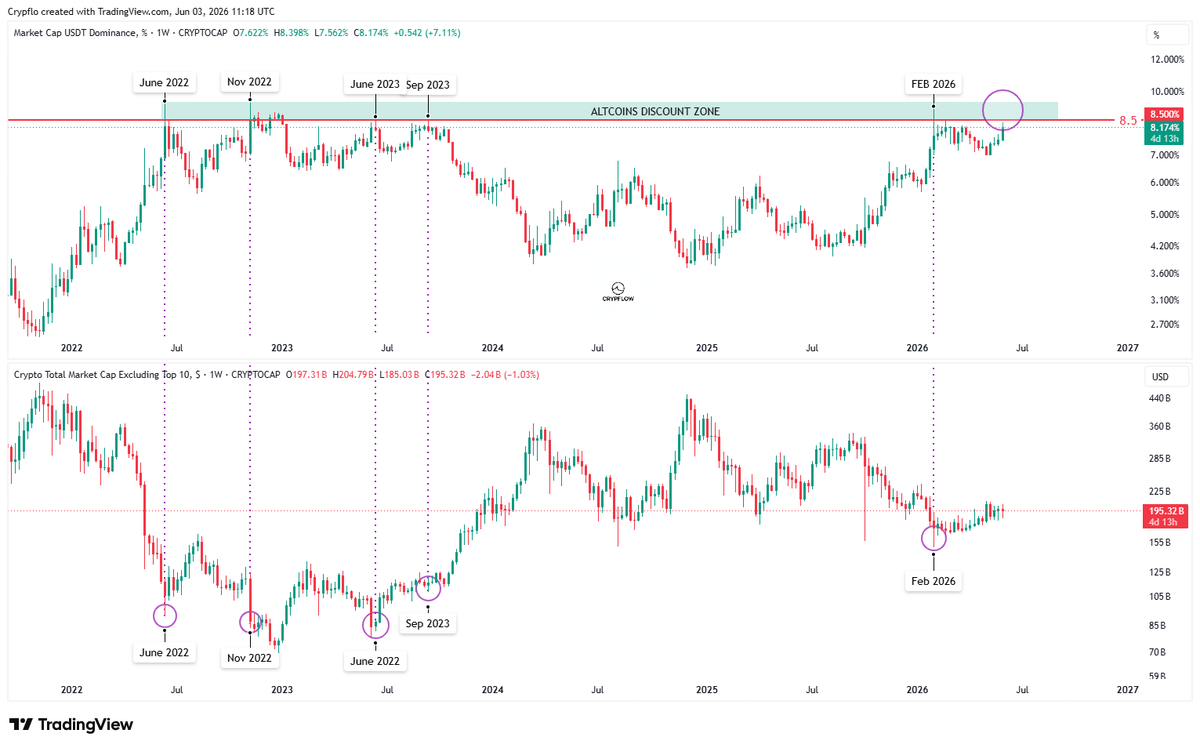
$USDT.D vs $OTHERS - This is when to buy altcoins.
Historically, whenever USDT dominance pushed above 8.5%…
altcoins were trading at deep discount prices.
June 2022.
November 2022.
September 2023.
February 2026.
Every single time:
fear was high, sentiment was dead and most people thought crypto was finished.
But those ended up being some of the best altcoin accumulation zones of the cycle.
And now USDT.D is approaching 8.5% again.
At the same time, the OTHERS market cap is sitting near cycle lows.
Most people buy altcoins after they already pumped 300%.
But the biggest opportunities appear when nobody wants them.
Be prepared.
@Haskarxxs Appreciate that a lot 🤝
That’s exactly why I keep revisiting the same charts over time. The real story is how structure evolves, not just a single prediction.
$BTC (1W) - Here we are. 👀
Yesterday I pointed out that BTC lost the 74K level on the weekly close and was likely heading for a retest of the multi-month downtrend.
That move is now happening.
BTC is currently retesting the exact area where the breakout started a few weeks ago with crucial support around 65K.
This is a very important zone.
If bulls step in here and BTC starts reclaiming momentum again,
this entire move could end up being nothing more than a brutal shakeout before continuation higher.
But if sellers keep control from here,
the risk of a deeper move toward 60K and lower increases fast.
$BTC (1W) - Retest of the multi-month downtrend next?
BTC lost the 74K level on the weekly close.
That level acted as major support during the April bounce, but bulls failed to hold it.
BTC now looks on track for a retest of the multi-month downtrend around the 60K-65K region.
And here’s the important part:
If BTC can hold that area and form a higher low there,
this entire structure could still turn into a massive reversal setup on the higher timeframes.
The next weeks are important.
This is where the market decides whether this was a breakout retest… or a failed reversal.
$ETH (1M) - Ethereum just entered the historical buy zone. 👀
Historically, every time Ethereum’s monthly RSI dropped below 43…
it marked a major long-term buying opportunity.
ETH just entered that zone once more.
History doesn’t guarantee outcomes.
But this signal has been incredibly consistent.