I just completed a powerbi fintech dashboard project. I worked with a synthetic dataset from kaggle an I built a 2- pages interactive report analyzing customer behavior, account activity, and loan performance. I handled the data cleaning using powerquery
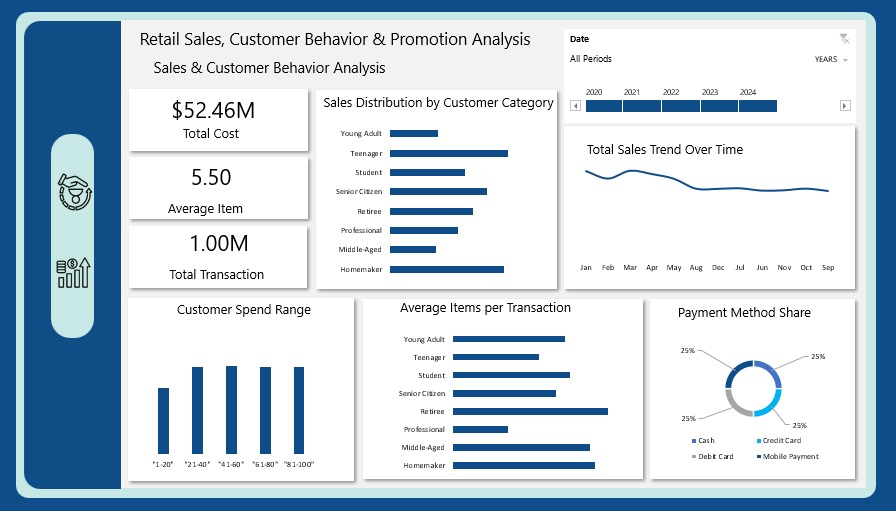
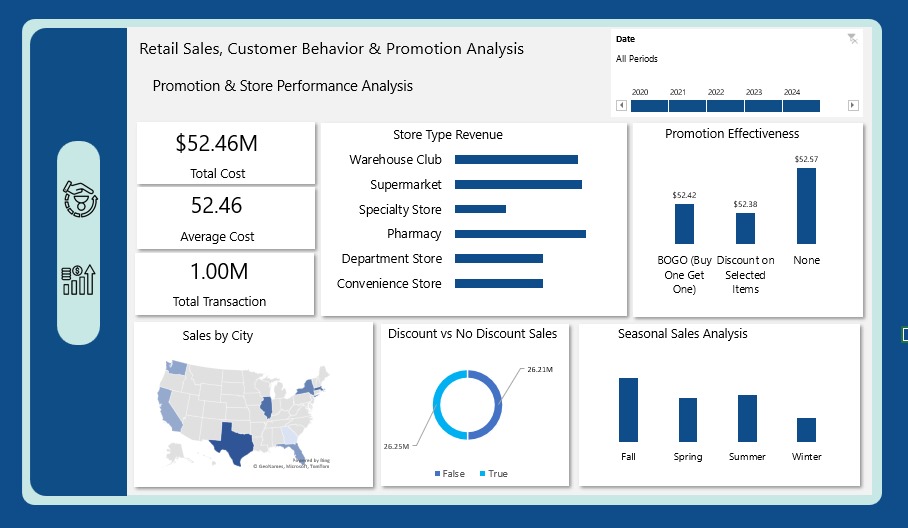
I just wrapped up a new project: Retail Sales, Customer Behavior & Promotion Analysis
This one dives into how retailers can boost revenue & optimize promotions by understanding customers, stores, and seasonal sales trends.
I just wrapped up a new project: Retail Sales, Customer Behavior & Promotion Analysis
This one dives into how retailers can boost revenue & optimize promotions by understanding customers, stores, and seasonal sales trends.
What excites me most about this project is how it connects data to real business value:
✔️ Customer behavior insights
✔️ Promotion effectiveness
✔️ Store & seasonal performance
Not just dashboards but actionable strategies. 🚀
Hiring isn’t just “apply → interview → hired.”
It’s a pipeline full of bottlenecks, mismatched expectations & hidden patterns.
I built a Recruitment Pipeline Dashboard (Excel + Power Query + DAX) to help HR teams see:
✔ Who’s in the talent pool
✔ Where candidates get stuck
Hiring isn’t just “apply → interview → hired.”
It’s a pipeline full of bottlenecks, mismatched expectations & hidden patterns.
I built a Recruitment Pipeline Dashboard (Excel + Power Query + DAX) to help HR teams see:
✔ Who’s in the talent pool
✔ Where candidates get stuck
✔ How sourcing & salary align
The takeaway?
Recruitment data isn’t about counting applications. it’s about finding the story:
Why some roles attract interest but don’t convert
Why certain experience groups move faster
Why strong hires sometimes come from unexpected places
How do you handle the data modeling btwn a fact table with two important dates and the date table? That was my challenge for this analysis but I was able to overcome it through the active and inactive relationships and DAX's 'USERRELATIONSHIP()' function to activate the inactive