the engineer who built Claude Code just dropped a 28-minute video on how to write prompts that actually work
I've seen $300 courses that don't cover what he shows in the first 10 minutes
CLAUDE.md files, memory shortcuts, parallel sessions, prompting patterns
all in one video and completely free
works whether you're a developer, a beginner, or someone who's been using Claude for months
based on this, I put together 18 things you can copy and use in Claude today
full guide in the article below
I recorded a 20-min video on how to set up footprint charts, including settings and use cases
0:14 - market orders
0:52 - passive/aggressive flow
1:48 - cluster vs profile
2:38 - dual cluster mode
3:51 - tick sizes
6:08 - other render & text types
7:33 - delta shading
8:20 - big player absorption
9:33 - colour settings
9:48 - point of control
10:32 - imbalances
13:40 - aggregating footprint
15:08 - open interest
17:15 - bar stats
17:57 - use case
Real talk. Getting too many DMs from people who want to start trading or are tired of gambling and want to start structured trading.
1. I wrote an article on how to start trading part time, read it, it will give you the mindset and make you judge yourself if you can actually do it.
2. Will then publish a you tube video, explaining all the tools you need to master to become a small profitable trader.
P.S. It will be a minimum of 6-9 months journey, nothing is easy here. You can do it but you may choose to do something else too.
Who is in?
I recorded a 18-min tutorial on how to read market profile correctly
0:30 - basics & setup
3:32 - more settings & tick size
5:39 - single prints
7:03 - poor highs/lows
9:03 - bart patterns
9:43 - initial balance
10:16 - volume vs time
13:16 - session tpo
15:02 - inside days
Every Single Tutorial/Strategy I've Ever Made:🧵
- Indexed
- Video + Written Format
- Introduction & Purpose Included
(will continue to add to this over time)
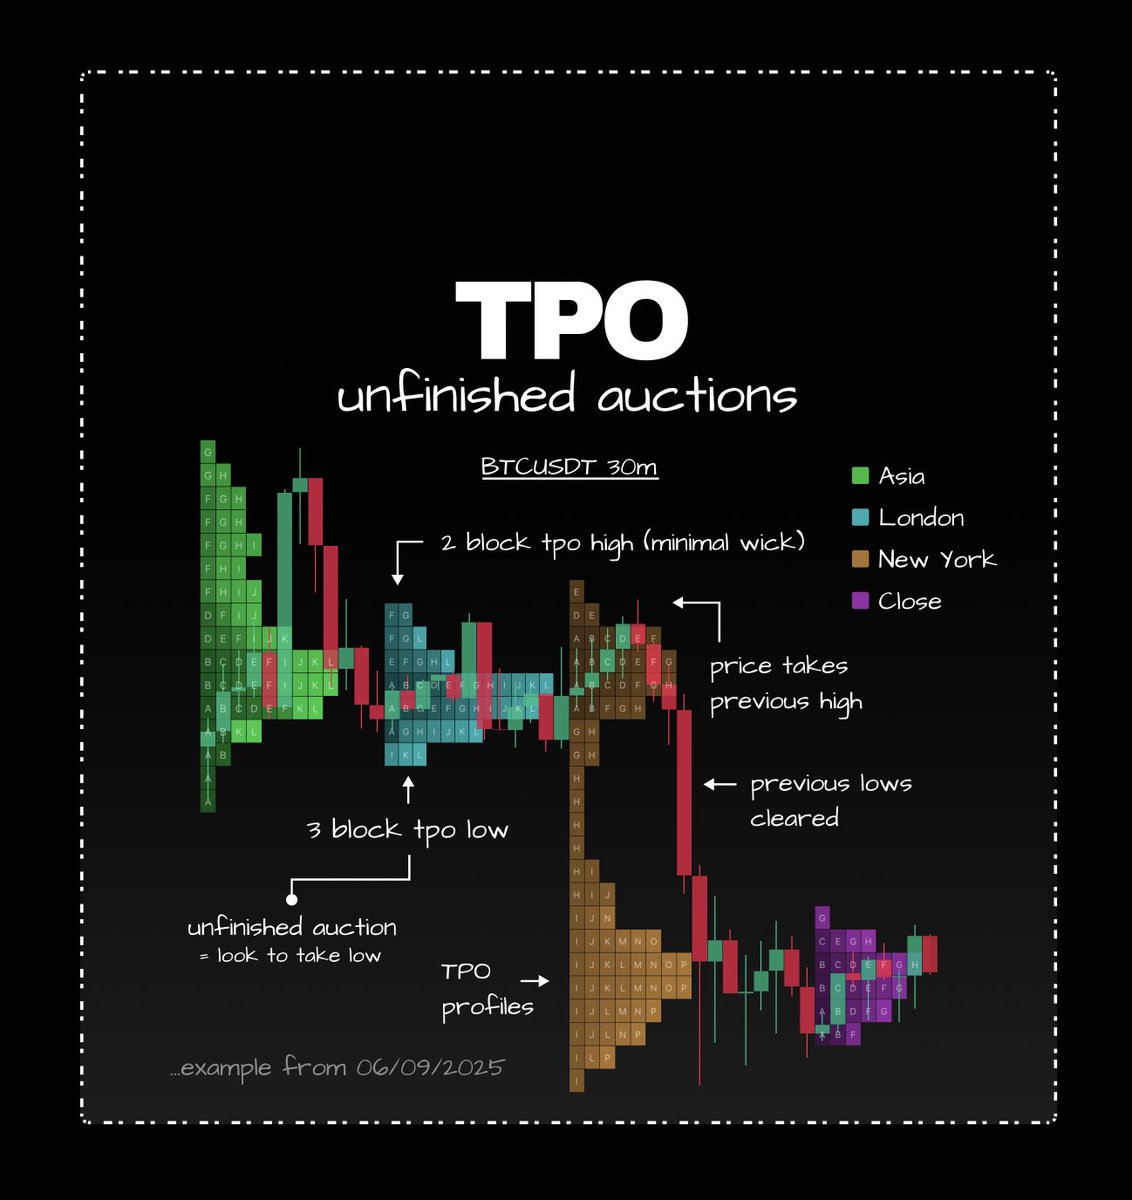
TPO
Unfinished auction areas are great to look for revisits in price.
When TPO profile highs and lows accumulate more than one block, suggesting price failing to auction quick enough to form swing pivots.
I like this on intra-day sessions. Tick 500
detailed example below ↓
Weakness
OI profiles are great for identifying signs of weakness in trends.
In uptrends looking at longs and shorts for downtrends, placing exiting positions against new positions.
Identify where majority of new positions become offside.
…in-detail example below ↓
My first mentor whom I found told me that all traders will become more profitable if they cut their losses whenever they start to hope for a good exit or for the price to come back at least to their entry.
This is the phase you want to avoid by treating trading as a boring business.
Have an exit? Then exit. Don't pray.
If you're in trouble, run back home. Don't pray to God to be nice to you. He gave you legs to run. Pray at the church, not when you're in trouble.
Easiest Time Frames for each trading style:
Scalping - 5 min
Day Trading - 15 min
Swing Trading - 4H
It took me years of trial and error to figure this out
Bookmark this. 🔖
The anatomy of a Failed Auction at Bitcoin ATHs:
✅ Break above the old ATH
✅ Price acceptance fails after hours
✅ Ideal entry on rejection
✅ Inefficiencies to the downside
Save this chart. It’s a textbook example you’ll want to revisit.
This setup has been my go to over the past 2 years.
allows for adding more size upon further confirmation.
exploits inefficient structures & eager traders on both sides.
explained ↓