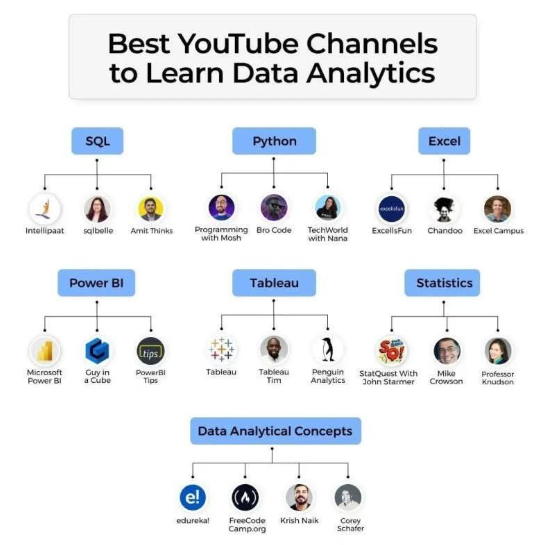
This is insightful. Having worked in both, I believe it’s time for analysts to focus toward problem-solving techniques, strengthen their understanding of statistics, and embrace AI to enhance their ability to interpret significance levels and drive meaningful impact.
It’s here! A full End-to-End Power BI E-Commerce Dashboard tutorial drops today at 6 PM!
From Power Query → DAX → visuals → dashboard layout → PowerPoint, I show you how to turn raw sales data into interactive, beautiful dashboards.
📺 Watch here: [https://t.co/a1lEZkSCBz]
𝗗𝗮𝘆 𝟭𝟴: 𝗣𝗮𝗻𝗱𝗮𝘀 + 𝗦𝗤𝗟𝗔𝗹𝗰𝗵𝗲𝗺𝘆 = 𝗗𝗮𝘁𝗮𝗯𝗮𝘀𝗲 𝗣𝗼𝘄𝗲𝗿.
Today was about connecting Python to real databases - no more toy datasets.
This is where your code starts talking to production systems.
𝗧𝗵𝗲 𝗠𝗶𝘀𝘀𝗶𝗼𝗻
Connect pandas to my MSSQL database using SQLAlchemy.
Sounds simple. It wasn’t.
Spent 3 hours wrestling with SQL authentication.
Nothing worked. Error after error.
Finally pivoted to Windows authentication - and boom, breakthrough.
Suddenly I’m pulling data from my actual database into Python.
Querying tables. Loading DataFrames. Viewing production data.
First time doing this. Felt like unlocking a new level.
𝗪𝗵𝘆 𝗜𝘁 𝗠𝗮𝘁𝘁𝗲𝗿𝘀
In real Data Engineering, data lives in databases - not CSV files.
SQLAlchemy is the bridge between your Python scripts and those databases.
Master this, and you can:
•Automate ETL pipelines
•Build dashboards on live data
•Pull data whenever you need it
This is how data engineers move from analyst to builder.
𝗧𝗮𝗸𝗲𝗮𝘄𝗮𝘆
Debugging isn’t failure - it’s the real learning.
Those 3 hours taught me more than any tutorial could.
Now I can pull live data into Python. That changes everything.
𝗡𝗲𝘅𝘁 𝗨𝗽: Deep dive into SQLAlchemy - connection engines, query building, and ORM basics.
𝗗𝗮𝘆 𝟭𝟴 𝗰𝗼𝗺𝗽𝗹𝗲𝘁𝗲.
Ever spent hours debugging auth issues? What finally worked for you?
#DataEngineering #Python #SQLAlchemy #ETL #LearningInPublic #BuildingInPublic #Datafam
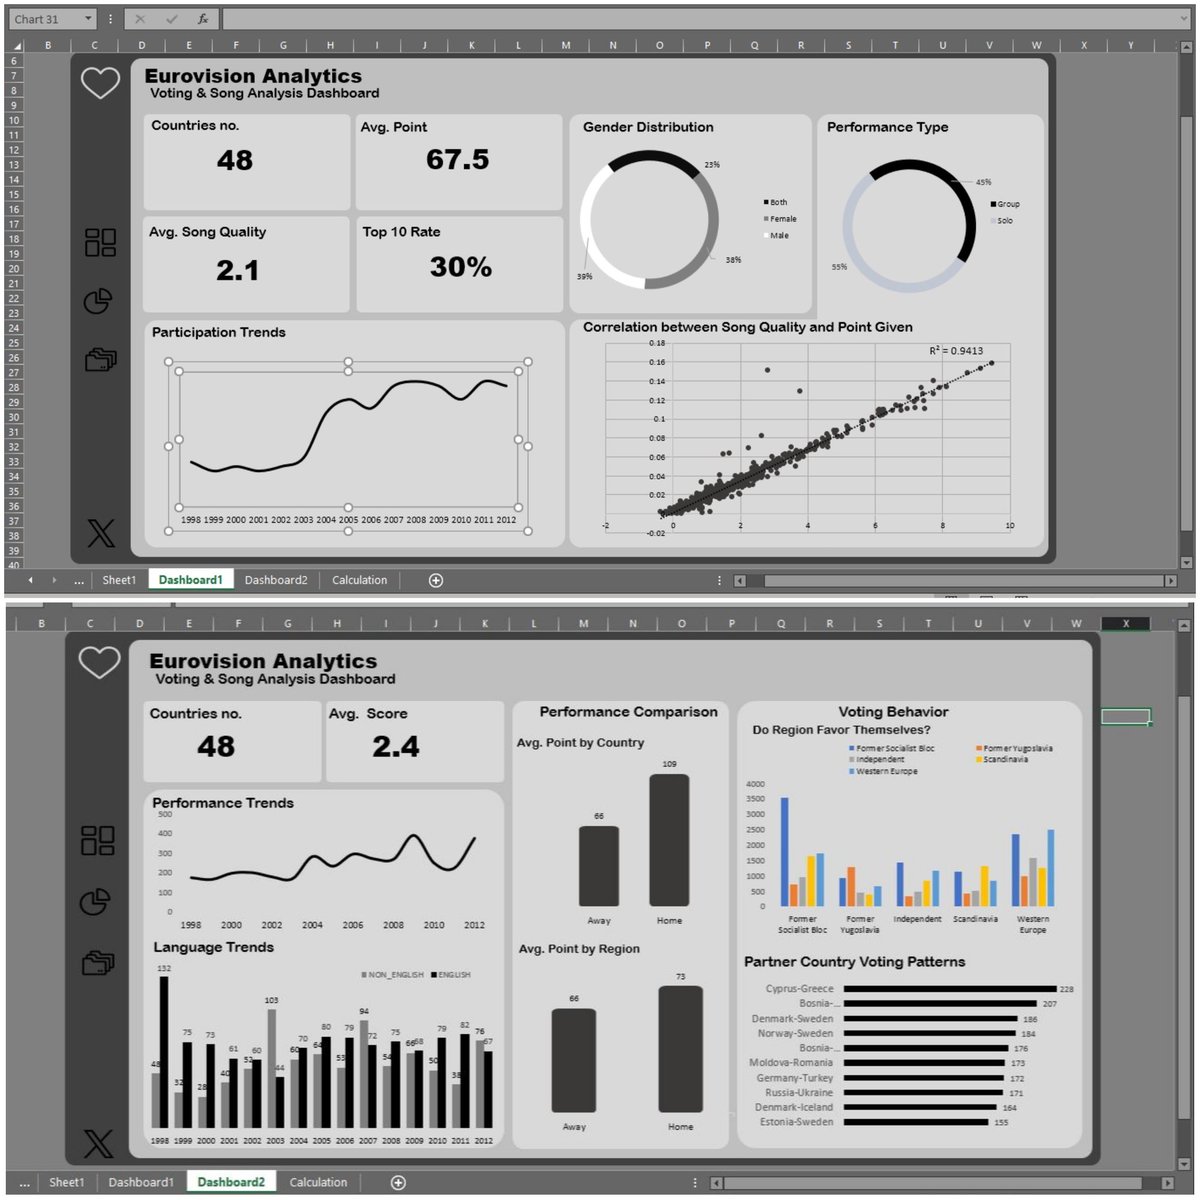
Made my first dashboard on Excel and I’m so gassed!����🤭
I followed a tutorial on @ObohX YouTube channel and recreated this dashboard.
Thank you so much for the helpful walkthrough, I learned a lot!
Hi Guys!
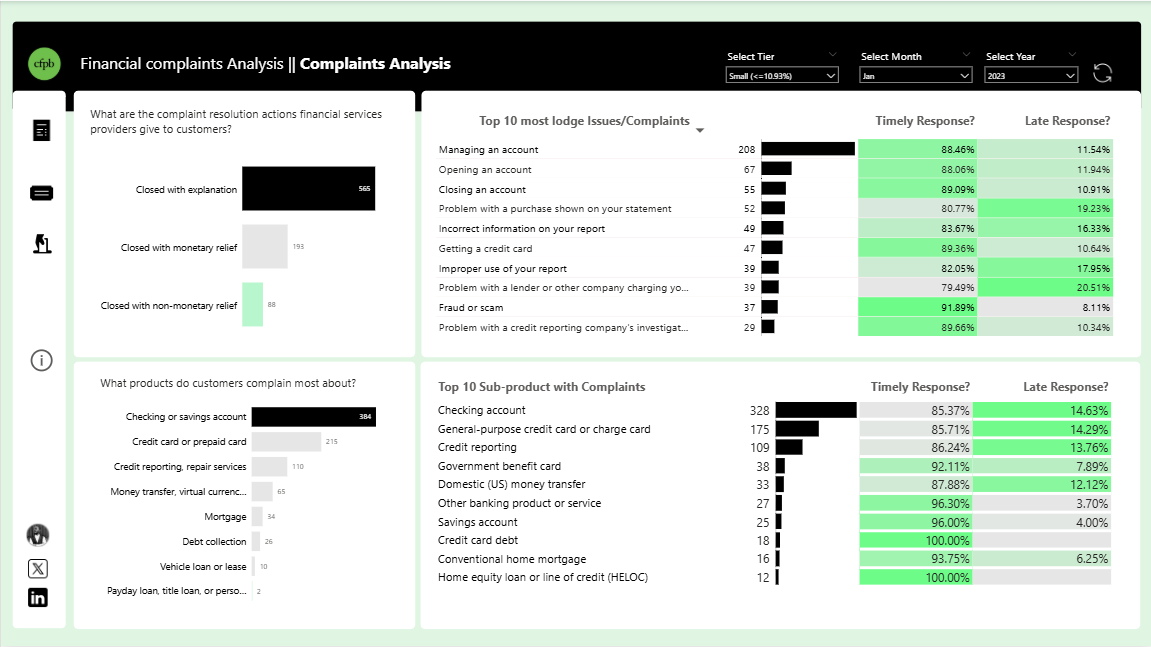
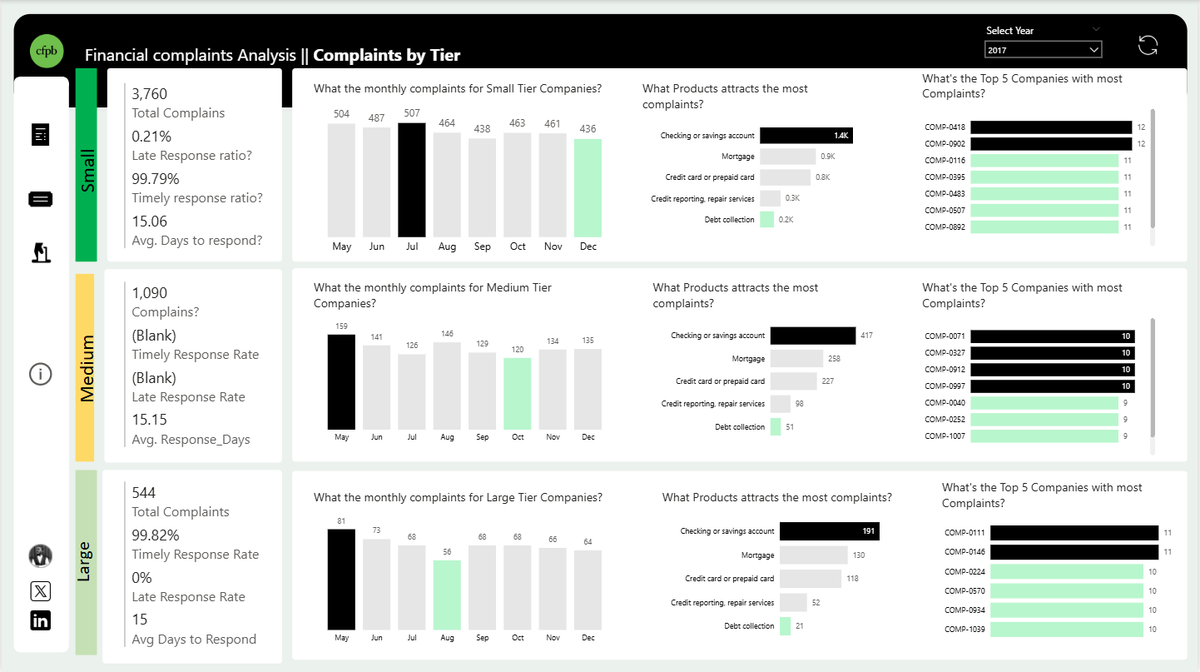
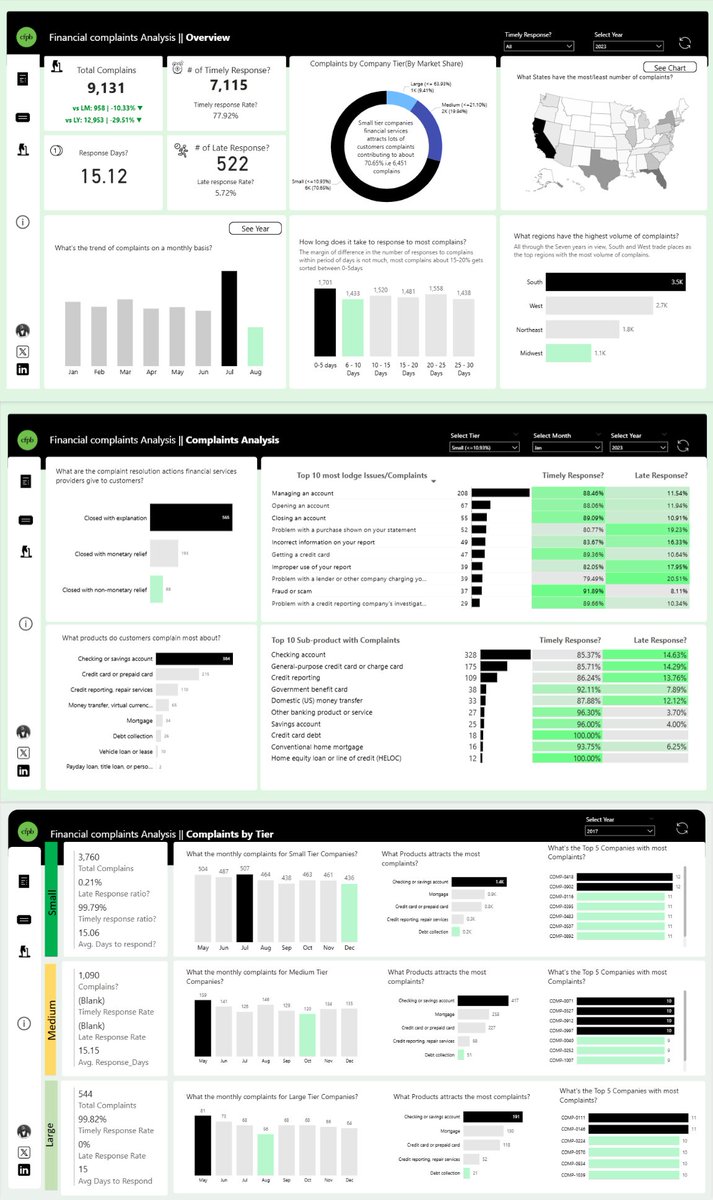
Glad to share this three-page @MSPowerBI report. My submission for the @Onyx Financial complaints data challenge for October, 2025.
Tools:
1. Analysis/Dashboard @MSPowerBI
2. Wireframe: @powerpoint
Interactive Link? Would add later. Ms Auth App been misbehaving
Arsenal is on the top of the table. Please remember Nanyuki and Nyahururu Stadiums so that we have 'Saliba' from Laikipia County - Laikipia Woman rep Jane Kagiri to President Ruto
Week 2 MetroBank analysis
Our latest financial data shows a strong upward trend! 🌱 With a focus on Millennials and Gen X, we're seeing consistent growth in our deposit balances. We're excited to see what the future holds! #FinancialGrowth#BusinessInsights#DataAnalytics@ObohX
Want to know what it takes to win Eurovision? 🏆 Our latest analytics dashboard breaks down the secrets to success! 📊 From the power of English songs to the undeniable advantage of "home" voting, we've analyzed the data. Let's make your next performance a guaranteed hit.
Winning Eurovision isn't just about the song. Our data shows a massive correlation between song quality and points given, plus a huge home-country voting advantage. We also found English-language songs dominate performance trends.
@Adordev_