추론 시장의 방향은 점점 더 분명해지고 있습니다.
과거에는 AI 경쟁이 “누가 더 큰 모델을 만들 수 있는가”에 집중되어 있었다면, 이제는 “누가 더 많은 추론을 실제 서비스로 제공할 수 있는가”의 경쟁으로 이동하고 있습니다.
GPT 계열, Sol, Kimi K3, Fable을 비롯한 다양한 모델들이 등장하고 있지만 공통점은 하나입니다.
모두가 더 긴 컨텍스트, 더 많은 에이전트 작업, 더 복잡한 추론 과정을 요구하고 있다는 점입니다.
중요한 것은 모델의 수가 늘어나는 것이 아니라, 모델 하나가 생성하는 추론 토큰의 양이 기하급수적으로 증가하고 있다는 사실입니다.
추론 비용이 낮아질수록 수요는 줄어드는 것이 아니라 오히려 폭발적으로 증가합니다. 인터넷 트래픽이 늘어날수록 네트워크 수요가 증가했던 것과 같은 현상입니다.
기업들은 이제 단순 챗봇이 아니라 코딩, 연구, 데이터 분석, 업무 자동화, 로보틱스 제어까지 AI를 연결하고 있습니다.
이는 곧 더 많은 GPU, 더 많은 HBM, 더 많은 네트워크, 더 많은 전력을 필요로 한다는 의미입니다.
현재 시장이 바라보는 AI 수요는 여전히 인간이 직접 사용하는 챗봇 중심의 관점에 머물러 있습니다.
하지만 앞으로의 시장은 AI가 AI를 호출하고, 수많은 에이전트가 동시에 작업을 수행하는 구조로 진화할 가능성이 높습니다.
그 시점이 오면 오늘의 추론 수요 전망조차 보수적으로 보였다는 평가가 나올 수 있습니다.
Morgan Stanley: GB200 and GB300 NVL72 Rack Shipments in June
Industry Overview
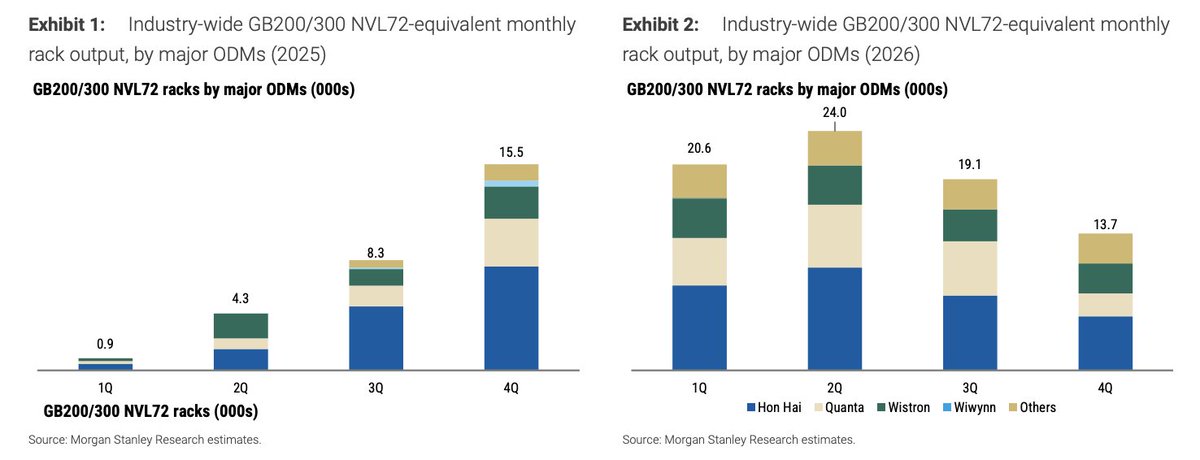
> June 2026 Performance: Total estimated GB200/300 rack output for June was approximately 8.0K units, representing a 5% month-over-month increase.
> Full-Year Forecast: The forecast remains at 70-80K racks for CY26, which represents more than 100% year-over-year growth compared to approximately 29K racks in the previous year.
Major ODM Shipments (June 2026 Estimates)
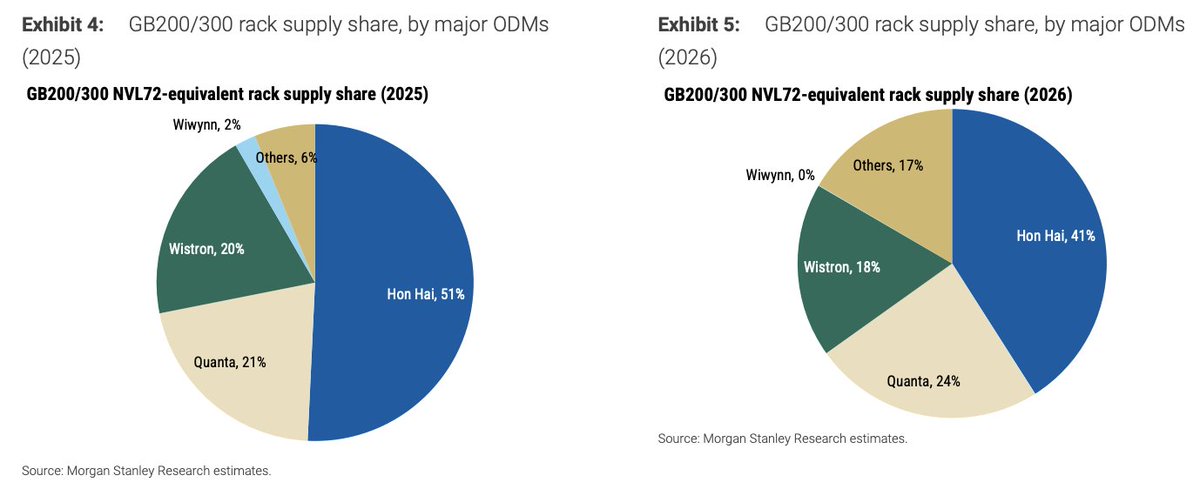
> Hon Hai: Shipped approximately 3.3K racks.
> Quanta: Shipped 2.3-2.4K racks (up from 1.8-1.9K in May).
> Wistron: Shipped 1.2-1.3K rack equivalents (down 5-10% month-over-month).
ODM-Specific Updates
> Quanta: June revenue grew 24% month-over-month to NT$385.2B, driven primarily by higher GB200/300 rack shipments. Overall 2Q rack shipments totaled 6.2-6.3K, slightly below the previous forecast, with the shortfall likely pushed to the second half of the year.
> Wistron: June revenue reached NT$321.8B (+11% month-over-month). While revenue in several segments (Wiwynn, monitor, desktop, notebook) increased, server computing tray shipments saw a slight decline. Total 2Q rack shipments were 3.9-4.0K units, slightly below previous projections, with the difference expected to materialize in 2H.
> Hon Hai: June revenue was NT$821.8B. Server-related revenue showed sustained momentum for AI products. The firm models Hon Hai's GB rack shipments as flat month-over-month at ~3.3K units, resulting in a 2Q total of ~10.3K units, slightly above the prior forecast of 10K.
> Within the major Server ODMs, Morgan Stanley's order of preference is Wistron > Hon Hai > Quanta, based on the upside to the price target (PT).
Morgan Stanley on Ajinomoto ABF:
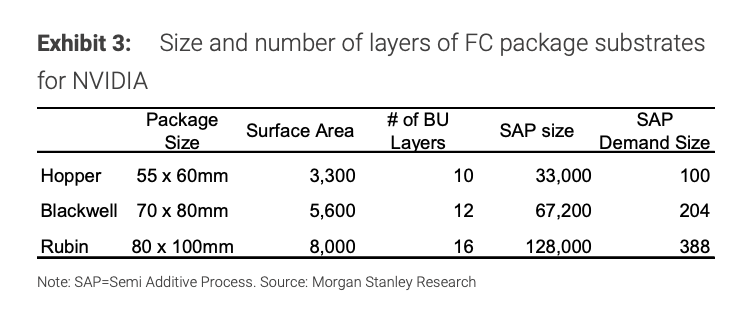
"For ABF, we look for increases in volume & ASP to accelerate growth, with a full year new plant contribution (onstream last October) and higher sales weighting of high spec ABF for applications such as AI. A shift to larger and higher layer count ABF products with the drive to higher value-added CPUs and GPUs has been increasing ABF sales volume and ASP. In flip chip package substrate application, Ajinomoto’s products are already used in the NVIDIA Blackwell GPU, which began volume shipment around 2024. In F3/27, we expect flip chip package production for the successor Rubin GPU to get fully underway, and to step up the pace of increase in ABF volume & price. We envisage functional materials subsegment sales up 24% YoY to ¥124.7bn in F3/27 (guidance: ¥111.6bn), 26% to ¥156.7bn in F3/28 and 27% to ¥199.5bn in F3/29."
First of all, I get this feeling with this whole memory cycle that everybody is talking from their own expertise and viewpoint, and nobody is looking at the whole picture. One side is talking from a wafer perspective, saying we can get this online. Another side is only looking at demand, without taking into account the ramp-ups in HBM4E and HBM5 in terms of specifications. I think everybody is shouting from one end of the room to the other, but nobody is taking the time to put everyone together in the same room and look at the complete picture.
That being said, the following:
First, the denominator of @pequityresearch his post. His 4–5% gap is ALL DRAM bits. HBM is roughly a tenth of DRAM bits. So a 25% shortage in HBM is only 3% of total DRAM it fits INSIDE his number. Both are true at once: the commodity plane can drift toward balance while HBM stays hard-rationed. When someone says "DRAM will balance," first question: which DRAM?
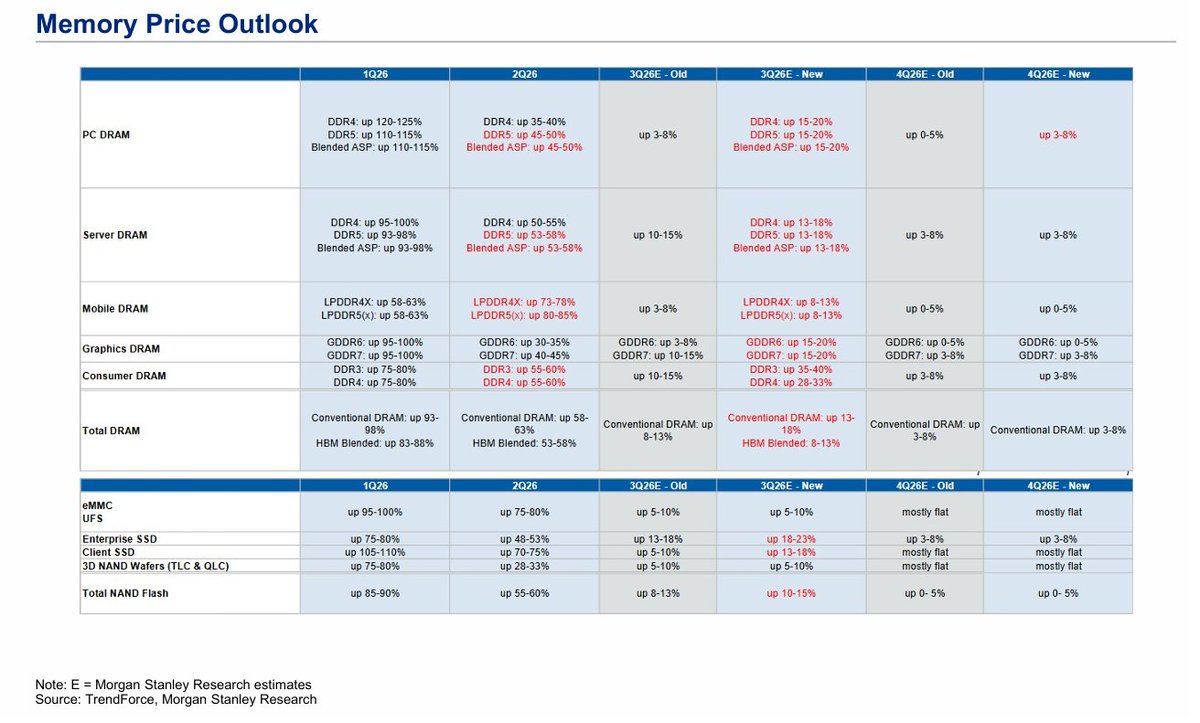
And "only 3% of bits" is exactly why it moves everything. HBM sells for at least five to ten times commodity DRAM per gigabyte a tenth of the bits already carries over a quarter of industry revenue, heading past half by decade-end, and most of the profit growth. Our revenue pool is exabytes times blended price; the conservative blend rises 15 to 23 $ per GB into 2028 on mix alone, before any like-for-like move. HBM and commodity DRAM are built on the same leading-edge wafers, and every HBM gigabyte eats 3–4x the wafer area. Leading-edge wafers migrating to AI memory HBM and now server LPDDR is what repriced conventional DRAM up 93–98% in one quarter. The 3% is the tail that prices the whole thing in this quoted post.
In chart below you see the argument in one picture. Every 2030 forecast if it’s bull, bear, or base. @zephyr_z9 pointed it out with 37.5 EB full frontier shipped Hbm4e at 1TB, hbm5 at 1,5TB it al comes down to what share of the world's best wafers gets fed to HBM. A quarter carries our locked supply floor. Half carries our band top. The most aggressive build in circulation needs 86 percent @zephyr_z9 (almost no hbm4 shipping only 4e and 5) at which point no commodity recovery is left to model. The wafers are gone. You cannot have the balance story and the HBM story out of the same fabs. Pick your point on the slider; that IS your thesis.
In addition, the input these models never state: HBM content per system in the very window they call balanced. Rubin carries 288GB per GPU. Rubin Ultra, shipping into that window, carries 576GB. The terabyte class I just explained comes after. Model 2028 systems at 2026 content and you understate HBM demand roughly 2x per system, more in wafers flattering both sides of the equation at once: too little HBM demand AND too many wafers left over for everything else. That's how a paper equilibrium gets built. No platform generation has ever carried less HBM than the one before it. Their balance assumes it. For now no evidence only increases in roadmaps.
Third, the elasticity everyone is about to cite: AI token demand elasticity around 1.4 cut price 30%, volume grows 40%+. Some read that as the cushion under any price decline. But token elasticity is not DRAM elasticity: four layers sit between a memory bit and a token, and the pass-through is neither one-to-one nor stable. More fundamentally elastic demand under rationed supply doesn't cushion a price fall, it prevents it. If volume surges the moment price dips and the fabs already ship everything they can build, where does the extra volume come from? Elasticity in a shortage isn't some shock absorber it is the fuel why we are in a shortage in the first place.
Fourth, the source. Senior employee. HBM CPO? Or osat? Or what does he do. You need to be at least fully strategy up to date and have the whole picture. I reffer back to my opening statement. the 1b-to-1c node point is real it closed much of the 2025 shortfall. But even on the most dense node at 95% yield I get shortage as outcome. 👇
$MU
Morgan Stanley: Memory
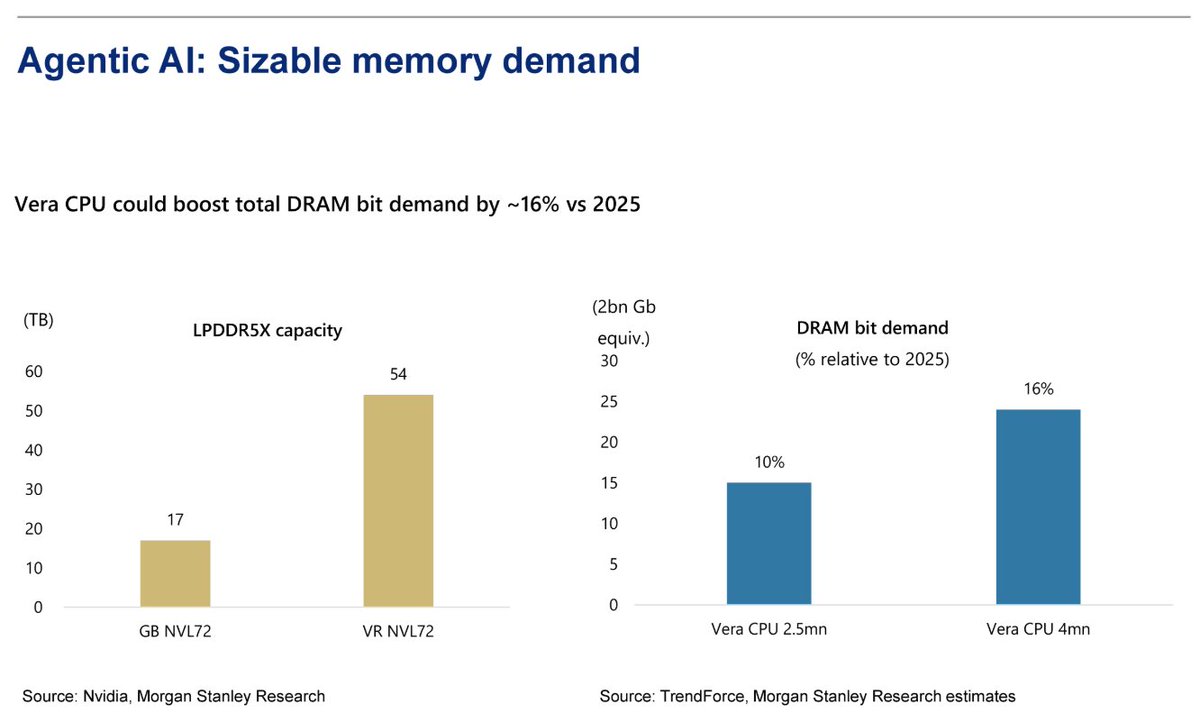
Agentic AI: Sizable Memory Demand
> Boost to DRAM Bit Demand: The implementation of Vera CPU is projected to increase total DRAM bit demand compared to 2025 levels. Specifically, a 2.5mn Vera CPU configuration is estimated to boost demand by 10%, while a 4mn configuration is estimated to boost it by 16%.
> Increased Memory Capacity: The transition from "GB NVL72" to "VR NVL72" shows a significant jump in LPDDR5X capacity requirements, rising from 17 TB to 54 TB.
DRAM Bit Shipment and ASP YoY Growth
> Decoupled Growth: The divergence between bit volume and Average Selling Price (ASP) shows that recent revenue gains are not driven by massive increases in raw shipment volume, but rather by surging prices for high-value products.
$MU $DRAM $EWY
Mizuho Securities: CPUs & GPUs
Market Forecasts & Growth
> Shipment Growth: Industry server CPU shipments are forecasted to reach 35 million units in 2026 and grow to 50 million units by 2027, representing a 40% year-over-year increase.
> Long-Term TAM: The long-term Total Addressable Market (TAM) estimate for 2030 has been raised to $170 billion (up from the previous $107 billion forecast), driven by higher CPU-to-GPU ratio assumptions for AI inference servers.
> CPU-to-GPU Ratios: The CPU-to-GPU ratio on AI servers is accelerating and is expected to approach 1:1 by the end of 2027 or 2028.
Supply Chain & Technical Bottlenecks
> DRAM Constraints: A critical bottleneck exists in DDR5/LPDDR5 supply, with a projected fulfillment ratio of only 70% over the next 12–18 months.
> Demand vs. Supply Gap: Based on current models, the 2027 demand for DDR5/LPDDR5X (over 300 billion 1Gb equivalents) significantly exceeds the projected supply (220–250 billion 1Gb equivalents).
> Potential Risks: The shortage of key materials—DRAM, substrates, and passives—is expected to persist through 2027 and could pose downside risks to downstream server assemblers, potentially leading to lower server rack output.
Key Player Insights (2027 Forecasts)
> Nvidia: Expected to reach 5.0–6.0 million units for the Vera CPU, including 2.0–3.0 million units specifically for agentic AI stack racks.
> Google: Axion CPU production is projected to increase more than 2x year-over-year, aligning with the growth trajectory of TPU units.
> AMD: The N2 Venice CPU is forecasted to exceed 6.0 million units.
GPUs/ASICs
Market Growth Projections
> Rapid Expansion: The total AI ASIC market is projected to grow from 4.1 million units in 2025 to 24.0 million units by 2028.
> Volume Drivers: The growth is driven by substantial increases in deployment by major hyperscalers including Google, Amazon (Annapurna), Meta, Microsoft, and OpenAI.
> External Demand: The market for external (non-Google) AI ASIC units is expected to surge from 0.6 million in 2025 to 7.2 million by 2028.
Key Hyperscaler Activity
> Google (TPU): Continues to be a dominant player, with total shipment units increasing from 2.5 million in 2025 to 7.1 million by 2028.
> Anthropic: Significant ramp-up is forecasted for their "TPU Ironwood/Sunfish" chips, moving from 0.6 million units in 2026 to 6.2 million units by 2028.
> Amazon/Annapurna: Shipments for the Trainium line are projected to double from 1.5 million in 2025 to 3.6 million by 2028.
> Meta: Rapid scaling of MTIA chips is expected, growing from 0.1 million units in 2025 to 2.7 million units by 2028.
Technical Trends
> Advanced Packaging & Nodes: There is a heavy reliance on sophisticated packaging technologies like CoWoS-L and CoWoS-S, and advanced foundry nodes including N2, N3, N4, N5, and A16.
> HBM Integration: Nearly all listed high-performance ASICs utilize High Bandwidth Memory (HBM), with a transition toward newer generations such as HBM3E and HBM4/4E to meet performance demands.
> ASP Variance: Average Selling Prices (ASP) range significantly, from approximately $2,000 for entry-level models to as high as $40,000 for top-tier specialized chips like the TPUv10.
$DRAM $EWY $MU $GOOGL $AMKR $TSM $ASE $NVDA $AMD $AVGO $MRVL $INTC $MSFT $META
JP모건은 SOX -20% 조정은 역사적으로 매수 구간이지만, 아직 투매가 끝났다고 보기는 어렵다고 밝혔다.
필라델피아 반도체지수 SOX는 밤사이 5% 하락하며 6월 고점 대비 낙폭이 약 19%까지 확대됐다.
JP모건은 이번 하락을 이례적인 붕괴가 아니라 반도체 사이클에서 반복적으로 나타나는 조정으로 평가했다.
지난 15년간 SOX가 고점 대비 20% 이상 하락한 사례는 총 17차례로, 사실상 매년 한 번꼴이다.
과거 SOX가 20% 하락한 뒤 평균 수익률은 다음과 같았다.
5거래일 후 +1.5%
20거래일 후 +8.0%
60거래일 후 +11.4%
역사만 보면 현재 구간은 중기 매수 기회에 가깝다.
다만 바로 바닥이라고 단정할 수는 없다.
17차례 중 5차례는 낙폭이 30%까지 확대됐고, 최악이었던 2022년에는 고점 대비 46% 하락했다.
현재 SOX는 50일 이동평균선을 이탈했으며, 100일 이동평균선까지는 약 10%의 추가 하락 여지가 남아 있다.
핵심은 펀더멘털보다 포지셔닝이다.
TSMC와 ASML은 강한 실적과 가이던스를 발표했고, 반도체 기업들의 EPS 추정치도 계속 상향되고 있다.
주가는 급락했지만 이익 전망은 무너지지 않아 주가와 EPS 사이의 괴리가 커지고 있다.
반면 미국 반도체 롱·숏 포지셔닝은 최근 12개월 기준 96퍼센타일에 위치해 있다. 자금 유출은 진행되고 있지만, 아직 모든 투자자가 포기하는 투매 단계와는 거리가 있다는 의미다.
결국 현재 하락은 실적 붕괴보다 과도하게 쌓였던 포지션이 정리되는 과정에 가깝다.
시장이 의심하는 것도 2026년 실적이 아니다. SOX가 올해 고점까지 65% 이상 상승한 만큼, 현재 논쟁은 2027~2028년 AI 반도체 이익이 시장 기대를 충족할 수 있는지에 집중돼 있다.
가장 중요한 변수는 다음 주부터 시작되는 빅테크 실적 발표다. 시장은 AI 수요 자체보다 2027년 데이터센터 CAPEX가 얼마나 확대될지 확인하려 한다.
문제는 기대치가 이미 매우 높다는 점이다.
매수 측이 기대하는 2027년 CAPEX 기준선은 다음과 같다.
알파벳 3,250억~3,500억 달러
아마존 약 3,000억 달러
메타 2,000억~2,250억 달러
마이크로소프트 2,000억 달러 이상
빅4 합산 기대치는 이미 1조 달러를 넘어섰다.
단순한 CAPEX 증가가 아니라 시장의 극단적으로 높은 기대치를 다시 상회해야 반도체 주가가 재차 강하게 상승할 수 있다.
결론은 명확하다.
SOX -20%는 역사적으로 좋은 중기 매수 구간이었다.
그러나 포지셔닝이 아직 높고 100일선까지 추가 하락 여지가 있어, 현재는 바닥을 단정해 한 번에 매수할 구간이라기보다 분할 접근이 필요한 구간이다.
다음 방향은 차트보다 구글·마이크로소프트·메타·아마존이 제시하는 2027년 AI CAPEX 신호가 결정할 가능성이 크다.
Morgan Stanley: ZAM Memory
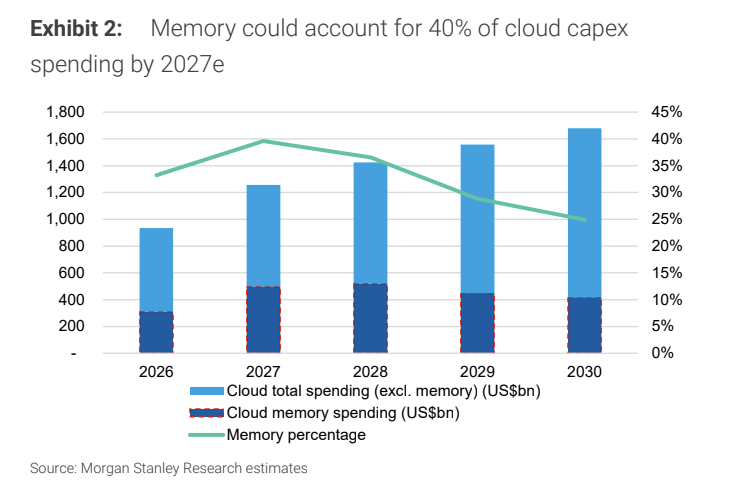
> Massive Cloud Capex Exposure: Cloud memory spending is projected to reach US$418 billion by 2030, representing an 8% CAGR from 2026. Memory spending could account for 40% of total cloud capex in 2027 (up from just 12% in 2023, prior to the AI boom).
> Bandwidth Lags Behind Processing: Memory bandwidth improvements (e.g., a +14% increase from DDR5-5600 in 2024 to DDR5-6400 in 2026) are failing to keep pace with explosive token growth, which expanded over 320x between April 2024 and June 2026 on major cloud platforms.
> Absolute Spend Peaking: Absolute cloud memory spending is forecasted to hit its cycle high in 2028e at roughly US$520 billion.
> The Post-2028 Softening: From 2028e to 2030e, even though overall cloud capex (excluding memory) is projected to rise to its highest level of $1.28\text{ trillion}$ by 2030, memory spending falls as a percentage of the total budget back down to 25% by 2030e.
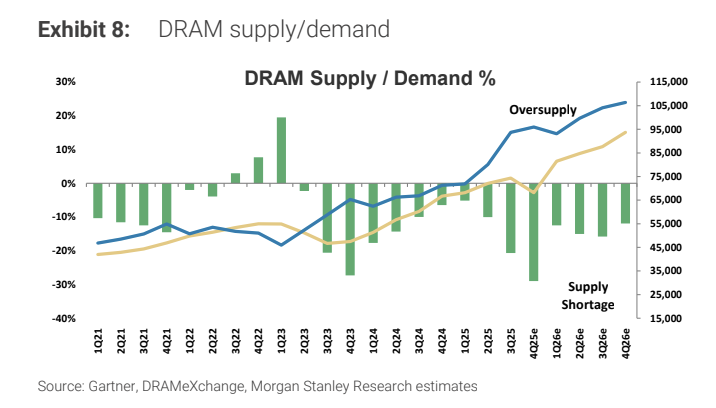
DRAM Supply/Demand (S/D) Imbalance
> Historical Context: The severe supply shortage of 2023 is clearly visible, bottoming out in 4Q23 near -28%.
> The Current 2026/2027 Tightness: Following a brief macro recovery, the market enters a sustained period of deep supply deficit. Through all of 2026e, the supply deficit hovers continuously between -10% and -16%.
> Supply Shortage to Persist: Looking ahead, the green bars indicate that the market remains structurally undersupplied, keeping DRAM conditions historically tight all the way through 4Q28e.
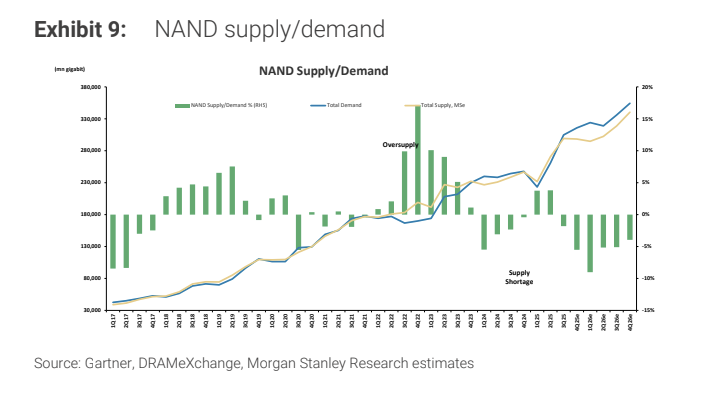
NAND Supply/Demand Dynamics
> The COVID/Post-COVID Glut: The massive NAND oversupply of late 2022 is prominent, peaking in 4Q22 with a +17% surplus.
> Structural Repricing Phase: After hitting a deep shortage in 1Q26e (dipping near -9%), the NAND deficit begins to gradually moderate, though it remains marginally in negative territory (undersupplied) near -3% to -4% through late 2026e.
> Transition to Enterprise Storage: This sustained tightness supports the report's thesis that NAND is moving from cheap consumer sockets up the memory hierarchy to act as massive LLM KV caches.
$DRAM $MU $SNDK $WDC $EWY
BofA: 3Q Memory
Key Takeaways from the 3Q Contract Price Check
> Strong Server DRAM Pricing: Up 20–30% QoQ, spearheaded by high-speed LPDDR5 (compared to the market consensus of 20% or less).
> Upbeat Spot Demand: Spot demand is healthy, driven by commodity DDR5 and legacy DDR4, with July prices increasing Month-on-Month (MoM).
> Transition to HBM4: There is a near-term rise in orders shifting toward higher-priced HBM4 over the cheaper HBM3e.
> Lower Long-Term Agreements (LTAs): LTA-based sales represent well below 50% of total DRAM sales (non-LTA portion is at 60–70%), allowing for solid QoQ price increases (e.g., 5–10%) that are often settled even under existing LTAs.
> Rush Orders: Sudden OEM rush orders confirm a QoQ price increase of over 20% for both commodity DRAM and NAND.
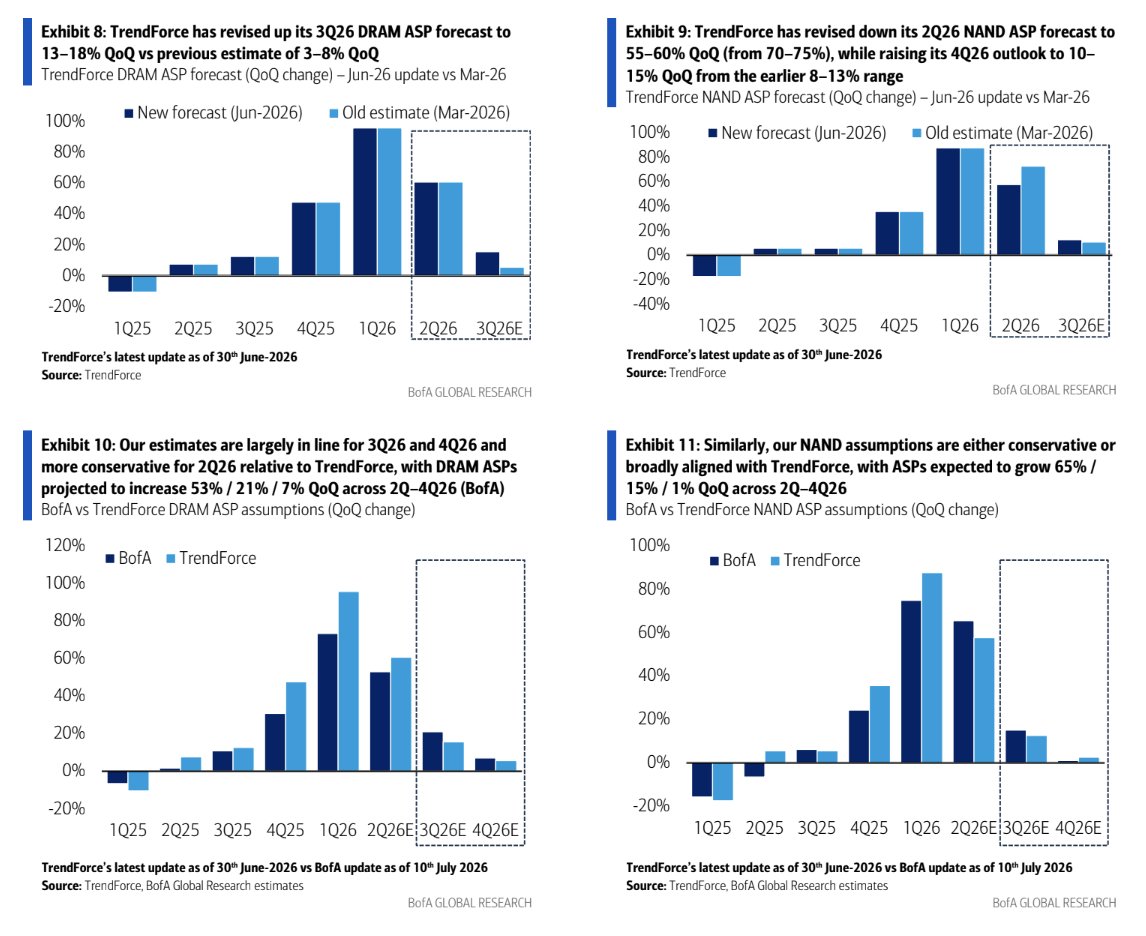
> Optimistic ASP Outlook: BofA forecasts a 21% QoQ rise in 3Q DRAM ASP, which is significantly more optimistic than TrendForce's assumptions (13–18% QoQ for conventional DRAM, or only 8–13% including HBM).
Spot Market Dynamics
> Price Rallies: DRAM spot prices have risen for eight consecutive weeks, defying earlier expectations of a price cap at US$35–40 for 16Gb DDR5.
> OEM Buying Behavior: Having previously cut device production to resist the spot-price rally, OEMs are now actively purchasing memory chips to prepare for high sales in September and the peak 4Q season.
> NAND Recovery: NAND spot prices rebounded, driven by a 4% Week-on-Week (WoW) rise in 1Tb wafers, supporting expectations of a 10%+ NAND ASP rise in 3Q.
$DRAM $MU $SNDK $WDC $EWY
하이닉스를 좋게 보는 이유 중 하나가 HBF 때문.
생각해보면 좀 재미있는 게, 왜 HBM을 더 빠르고 고성능으로 만들지 않고, 오히려 조금 낮추면서 아래쪽을 끌어올리는 선택을 했을까?
HBF는 HBM보다는 느리지만, 일반 SSD보다는 훨씬 빠른 중간 단계 메모리임.
HBM은 진짜 빠르지만 용량이 작고 비싸고 전기도 많이 먹고, SSD는 용량은 크지만 너무 느리고. 그래서 그 사이를 메워주는 새로운 층을 만든 거임.
이 선택은 결국 시장 수요가 HBM 수준의 초고성능까지만 원한다는 뜻으로도 볼 수 있음.
더 높은 스펙이 나와도, 실제 AI를 쓰는 단계에서는 큰 의미가 없다고 봄. 오히려 충분히 빠르면서도 용량이 크고, 전력도 적게 먹는 게 더 중요해진 상황이 됨.
거기다 Physical AI 사이클까지 겹치면서, 과도하게 스펙 높은 거보다는 스스로 추론할 수 있을 정도의 전력만 있으면 된다는 방향으로 간다고 봄.
Morgan Stanley: HBM & NAND Supply/Demand
HBM (High Bandwidth Memory) Market & Supply
> Market Size Expansion: The total HBM market value is projected to explode from US$3 billion in 2023 to US$94 billion by 2027e, representing a massive 128% CAGR.
> NVIDIA Market Share: NVIDIA is expected to maintain overwhelming dominance in the GPGPU market, keeping its market share consistently at 90% or above through 2027e (peaking at 92% in 2026e).
> Soaring HBM Intensity: The average HBM content per GPGPU is modeled to increase from 80 GB in 2023 to 317 GB in 2027e. Average HBM content per ASIC is also scaling up, from 40 GB to 238 GB over the same period.
HBM Supply Shares (2027e Implied Production):
SK Hynix: 22,226 million Gb
Samsung: 21,239 million Gb
Micron: 10,372 million Gb
> Widening Deficits: While HBM-specific supply appears to outpace standalone HBM demand, the broader DRAM market faces a severe squeeze. The Total DRAM sufficiency ratio (combining both HBM and commodity DRAM) is projected to plunge to -17% in 2026e and remain deeply negative at -15% in 2027e.
AI NAND Market & Supply
> Surging AI NAND Demand: Demand for AI NAND is modeled to nearly triple, rising from 205 EB (Exabytes) in 2025 to 609 EB in 2027e.
> AI as a Percentage of Total NAND: AI's share of total global NAND demand is expected to climb sharply from 18% in 2025 to 41% by 2027e.
Key Hardware Drivers (2027e):
ASIC eSSD Usage: Major demand is driven by Google TPU (33 EB) and AWS Trainium (19 EB).
GPGPU eSSD Usage: Driven heavily by NVIDIA platforms (63 EB extra deployment per tray + 34 EB in-rack eSSD) and AMD's MI-series (37 EB).
> NAND Sufficiency Deficit: After a slight supply surplus of +2% in 2025, the total NAND market is projected to flip into a severe deficit of -15% in 2026e and remain under-supplied at -9% in 2027e.
> Non-AI Demand Remains Flat: Meanwhile, non-AI NAND demand (PCs, smartphones, general enterprise SSDs) is projected to remain relatively flat, moving from 905 EB in 2025 to 874 EB in 2027e, showing that AI is entirely driving the market's tight supply dynamics.
$DRAM $MU $EWY $SNDK
BofA: Global Memory
> Super-Cycle Intact: The BofA memory indicator remains near record highs (reaching 183 in May, well above past peaks of 120–130). High-end memory demand (HBM4, SOCAMM, etc.) continues to drive exceptional strength.
> Massive Revenue Growth Forecasted for 2026: Global DRAM revenue is expected to nearly quadruple (+325% YoY) in 2026, primarily driven by a sharp rebound in Average Selling Prices (ASPs). NAND revenue is similarly projected to jump nearly fourfold (+299% YoY) in 2026.
> Servers & AI Dominating DRAM: Servers—especially AI systems utilizing High Bandwidth Memory (HBM)—now account for over half of total global DRAM demand due to high memory density per system.
> SSDs Fueling NAND: Enterprise and data center Solid State Drives (SSDs) utilized in AI applications now make up more than 50% of total NAND demand and sales, commanding a price premium over standard IT applications.
> Sizable Share of AI Hardware Budgets: High-bandwidth memory (HBM) and advanced data center memory now command a massive 35% to 40% of total cloud AI infrastructure spending. Big Tech's cloud and AI capex is projected to push close to $1.5 trillion by 2027.
> HBM Supply Cannibalization: Producing an HBM chip requires 3x to 4x more silicon wafer capacity than traditional DRAM. Because they share the same production lines, manufacturers are prioritizing high-margin HBM, starving the market of standard capacity.
> DDR5 Premium Disappears: The rapid exit of tier-one manufacturers from mature products has triggered a severe, structural shortage in legacy DDR4. BofA notes that spot prices for 16Gb DDR4 and DDR5 have essentially converged into the $35–$40 range. The traditional technology premium of DDR5 over DDR4 has largely vanished because manufacturers are dropping DDR4 production faster than PC and server customers can physically transition their setups.
Massive Revenue Surge Forecasts (2026E)
> Total Market Expansion: Combined DRAM and NAND revenue is projected to nearly quadruple to $891.8 billion in 2026E (up from $214.8 billion in 2025).
> DRAM Performance: DRAM revenue alone is expected to increase by +325% YoY to $568.8 billion in 2026E. This hyper-growth is heavily back-loaded, with quarterly revenue ramping up aggressively from $83.9 billion in 1Q26E to $182.6 billion by 4Q26E.
> NAND Performance: NAND revenue is forecast to surge +299% YoY to $323.1 billion in 2026E, climbing from $45.3 billion in 1Q26E up to $102.4 billion in 4Q26E.
High-Bandwidth Memory (HBM) Deep Dive
> TAM Scaling: The Total Addressable Market (TAM) for HBM is projected to hit $76.8 billion in 2026E (+122% YoY) and skyrocket to $134.6 billion by 2027E.
> Astounding Profitability: The industry average Operating Profit Margin (OPM) for HBM is sitting near a massive 49% for 2026E, climbing even higher to 54% in 2027E.
The Technology Shift (HBM Mix):
2026E: Mainstream volume is dominated by HBM3e (60%) and HBM4 (32%).
2027E: The mix flips heavily into HBM4 (64%), while the next-gen HBM4e begins its entry at 19%.
2028E–2030E: The long-term horizon shows rapid transition into HBM5+, which is expected to command 79% of the market mix by 2030E.
> Server Intensity: AI+HBM server units are scaling to 4.5 million systems in 2026E, with memory intensity per server jumping to 1,413 GB per AI server.
Pricing (ASP) & Shipment Dynamics
> The Rebound Driver: The entire super-cycle is pricing-driven. Blended DRAM Average Selling Prices (ASPs) are modeling a +249% YoY expansion in 2026E ($13.0 per 8Gb equiv. unit vs. $3.7 in 2025). Blended NAND ASPs are modeling a +238% YoY increase.
> Quarterly Pricing Velocity: The fastest pricing momentum occurs in the first half of the year, with DRAM ASP growth showing a massive +73% QoQ spike in 1Q26E and +53% QoQ in 2Q26E, before cooling down to normal levels (+21% in 3Q, +7% in 4Q).
Capex & Capacity Expansions
> Massive Investment Outlays: Total industry Capex spending (DRAM + NAND) is projected to jump +62% YoY to $118.7 billion in 2026E.
> DRAM vs. NAND Split: Manufacturers are funneling the vast majority of cash into DRAM, ramping DRAM capex by +65% YoY to $88.6 billion. NAND capex is expanding much more modestly at +55% to $30.1 billion.
> Wafer Capacity: Total DRAM wafer capacity is expanding to 2,066k wafers per month in 2026E, out of which 23% of all global DRAM wafer capacity is being swallowed up solely by HBM production.
$MU $SNDK
주식시장에서 결국 돈 버는 5가지 유형:
1.1년 내내 예수금만 쥐고 있다가 딱 2~3번만 매매하는 사람.
평소에는 현금 가득 들고 세상 편하게 관망합니다. 그러다 대폭락장, 투매가 나와서 온 시장이 공포에 질려 던질 때 귀신같이 들어갑니다. 먹을 만큼 먹으면 미련 없이 나와서 다시 다음 기회를 기다립니다.
2.좋은 종목 진득하게 묻어두고 버티는 사람.
우량한 기업 몇 개 골라서 사놓고 숨도 안 쉽니다. 비교적 저점일 때 사서 몇 년, 길게는 10년 넘게 가져갑니다. 배당금 나오면 재투자하고, 시간의 복리 효과로 천천히 부자가 됩니다. 애초에 20~30% 먹으려는 게 아니라 몇 배, 몇십 배 수익을 목표로 합니다.
3.아는 종목만 패는 박스권 매매(박스권 트레이더).
눈에 익은 몇 개 종목만 지독하게 파고듭니다. 지지선 하단 오면 사고, 저항선 상단 오면 팝니다. 욕심 안 부리고 아는 구간에서만 반복 매매하면서 1년 내내 야금야금 자산을 불립니다.
4.산업 사이클(주기)을 먹는 사람.
업황 주기를 완벽하게 공부해서 산업이 최악의 바닥일 때 들어갔다가, 역대급 호황(고점)일 때 털고 나옵니다. 몇 년에 한 번 매매하지만 한 번 먹을 때 제대로 크게 먹습니다. 사이클에 대한 이해도가 엄청난 사람들입니다.
5.배당금 모으는 주주형 투자자.
주가 등락에는 크게 신경 안 쓰고 오직 '배당'만 봅니다. 주가 떨어지면 오히려 싸게 더 모을 수 있어서 좋아하고, 주가가 기어가면 배당금 받아서 또 삽니다. 주로 은행주나 인프라, 고배당주에 투자하는 분들이 이런 논리입니다.
여러분은 몇 번 유형이신가요?
다음 주 주목해야 할 종목과 투자 자료는 댓글과 프로필에 정리해 두었습니다.
오늘 자 SK 최태원 회장의 블룸버그 인터뷰 내용을 정독했는데,
AI나 반도체 투자하시는 분들은 꼭 보셔야 할 역대급 인사이트가 많네요.
단순히 "HBM 잘 판다" 수준이 아니라 시장의 구조적 변화를 정확히 짚고 있습니다.
중요한 포인트들만 자연스럽게 풀어서 정리해드림.
먼저 SK하이닉스의 미국 ADR 상장 추진 소식.
이게 단순한 주식 거래 확대를 넘어 글로벌 자본을 당기고 미국 현지 탑티어 인재를 영입하기 위한(스톡옵션 활용) 전략적 교두보더라고요.
인터뷰에 나온 265억 달러(약 36조 원)가 거액 같지만,
최 회장은 SK의 전체 투자 스케일에 비하면 "지나치게 큰 수준은 아니다"라며 상당한 자신감을 보였습니다.
기술적으로 가장 소름 돋는 부분은 'KV 캐시(Key-Value Cache)' 수요 폭발을 예측한 점입니다.
과거엔 스마트폰 판매량 같은 '사람 수'에 따라 메모리가 늘어났다면,
이제는 인간이 안 써도 AI 에이전트들이 24시간 작동하며 데이터를 소모하죠.
특히 LLM 추론할 때 이전 문맥을 기억해두는 'KV 캐시' 때문에 메모리 대역폭과 용량 수요가 기하급수적으로 늘어납니다.
우리가 말하는 메모리 병목의 실체를 정확히 짚은 거죠.
지금 공급 부족이 어느 정도냐면,
하이닉스가 향후 5년간 생산 능력을 2배 늘릴 계획인데도 엔비디아나 빅테크 고객사들은 "그걸로 턱없이 부족하니 지금보다 5~6배는 더 달라"고 난리인 상황이랍니다.
HBM은 공정 난이도가 높아서 단기에 늘리기도 어렵고요.
최 회장은 이 쇼티지가 일시적 사이클이 아니라,
AGI(범용 인공지능)가 우리 사회에 완전히 정착할 때까지 장기 지속될 거라 내다봤습니다.
결국 SK의 종착지는 단순 HBM 제조사가 아닙니다.
이 강력한 하드웨어 주도권을 쥐고 AI 데이터센터(AIDC) 인프라, 자체 LLM 개발, 로봇·피지컬 AI, 헬스케어까지 AI 생태계 전반을 다 먹겠다는 'AI 풀스택' 로드맵을 대놓고 드러냈습니다.
판을 정말 크게 짜고 있네요.
마지막으로 요즘 핫한 'AI 거품론'에 대해서는, 일부 주가 과열은 있을지언정 "AI 기술 자체는 현실"이라고 선을 그었습니다.
기술이 발전하면서 토큰 비용(추론 비용)이 계속 낮아질 거고,
결국 전기나 인터넷처럼 누구나 일상적으로 쓰는 대중화 시대가 필연적으로 온다는 논리입니다.
단기 노이즈보다 이 거대한 공급 부족과 생태계 확장 흐름에 집중해야 할 때 같습니다.
-오선의 SAVE-
Bernstein: Japan+China Memory Interface Chip primer
1/ The CPU is un-retiring
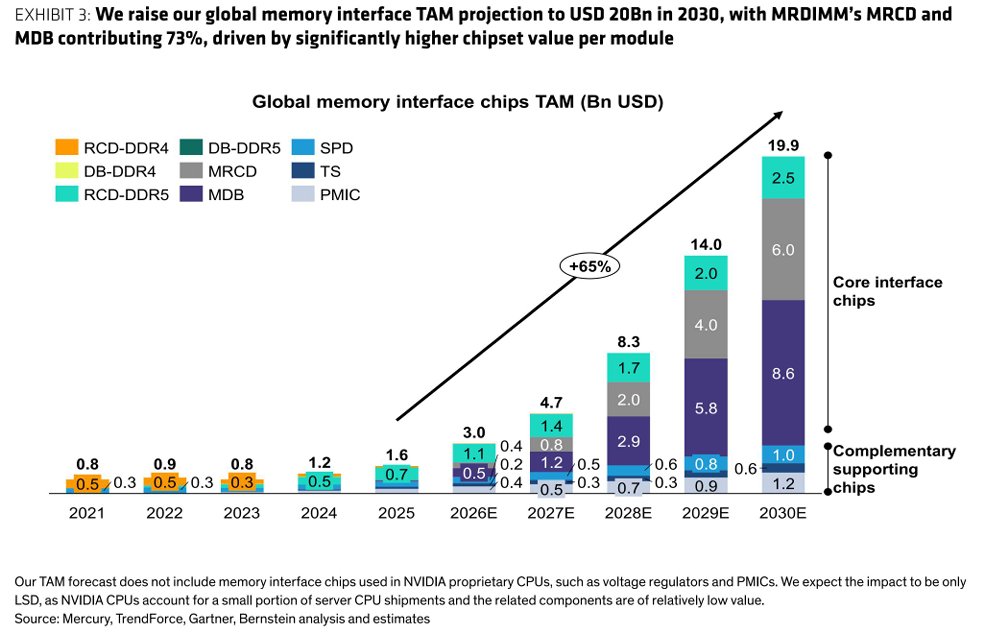
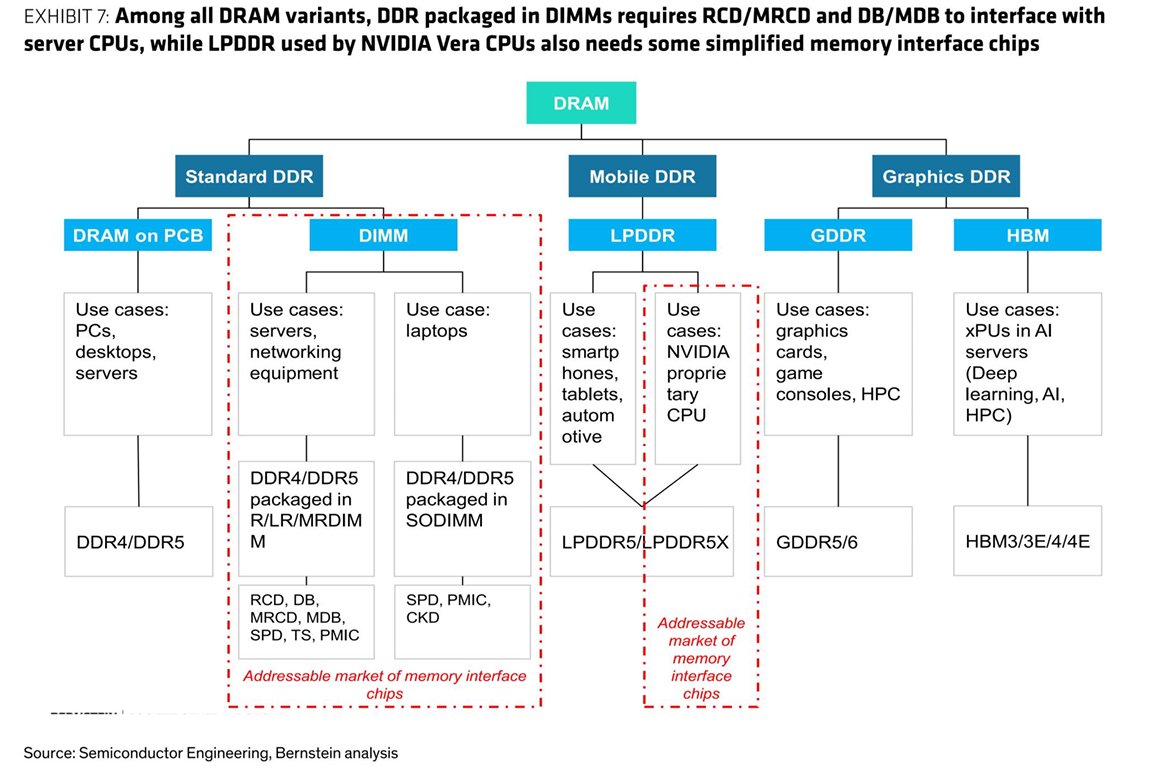
As AI shifts from GPU training to inference and agentic work, the server CPU takes back the workload, and the little chips wiring the CPU to its DRAM get paid for it. Bernstein sizes the TAM at $20bn by 2030, 65% CAGR, 3x their old number. Reiterate O on Montage and Renesas.
2/ Three drivers stacking
→ Server CPU units 30.6mn to 89.3mn by 2030, AMD just doubled its x86 server TAM to $120bn
→ More DRAM per CPU, channels going 8 to 12 to 16, AI servers filling 70-80% of slots vs ~50% on general purpose
→ More silicon per module from MRDIMM They multiply, not add. That's why the TAM grows 3x faster than CPU units.
3/ MRDIMM is the story
MRDIMM runs 1 MRCD + 10 MDB vs a single RCD on RDIMM. Content per module goes ~$7 to ~$70-80, call it 10x. Penetration 3% in 2026 to 25% by 2030 on Bernstein's math, and by 2030 MRDIMM chips are ~73% of the whole TAM. A pool that barely existed last year.
4/ This isn't LRDIMM again
The bear case is DDR4 LRDIMM had the same fat content and never cleared 1% of shipments. Difference is physics. LRDIMM added capacity nobody needed. MRDIMM doubles bandwidth past the point where RDIMM breaks down at 8800 MT/s, and both Intel and AMD are committed. Pulled by the workload, not pushed by a spec sheet.
5/ The moat is why you care
Three players, Montage ~37%, Renesas ~36%, Rambus ~20%, so ~92% of the market. Guarded by 18-24 month JEDEC qual cycles every generation, and Montage plus Renesas sit on the board writing the specs. The chip is a rounding error on module price but critical to performance, so customers pay up and never switch. Intel quit after DDR2, TI after DDR3.
6/ The supercycle helps here
Usual fear is the interface premium blocks adoption. It's the opposite. As DRAM die prices rip, the MRDIMM premium shrinks to ~10% of a 128GB RDIMM, so expensive memory actually pushes buyers toward MRDIMM. The thing scaring people about the memory cycle is the thing pulling this one forward.
7/ The value gap
Montage PT up to CNY 400 / HKD 520 from 220 / 320, 50x 2BF P/E, 27/28 EPS lifted 19% and 73%. Renesas is the sharper one. Its interface business is similar scale to Montage's while being just 6% of revenue, but its cap is only 25% above Montage's. Bernstein says management's own 20-30% CAGR guide is too low and models 42%.
8/ Right thesis, wrong entry
Not a buy today. The names ran since April, gave back 10-30% off the highs, and Bernstein expects more near-term weakness on memory sentiment, profit-taking, and substrate-shortage earnings risk for Montage and Rambus. The call is buy the dip on a 12-month view once the market starts looking at 2028.
9/ Net
Compute is sliding back to the CPU, the interface chip is the geared way to play it, and MRDIMM's 10x content jump is the durable leg. A protected oligopoly with real pricing power, the moat the humanoid names don't have. Own the dip into rising MRDIMM penetration, watch DDR6 timing as the swing factor, Renesas the mispriced one. Montage and Renesas the picks. It's actually ludicrous how much coverage I've seen for 6723 the last week.
Bernstein: New Memory LTAs, part 2
1/ The bear case on memory is "we've seen LTAs before and they blew up." Newman goes back to the two that failed, Microchip and Hemlock, and argues the new SanDisk and Micron memory LTAs are built differently. Reiterate O on SanDisk, PT $3,000.
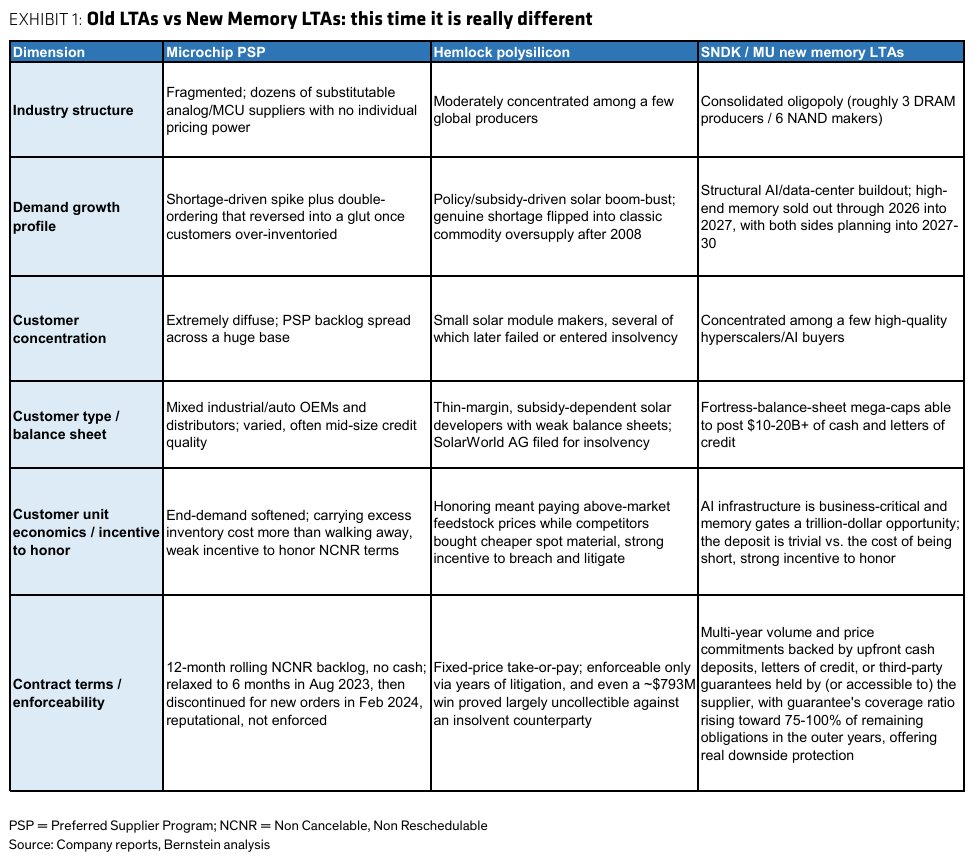
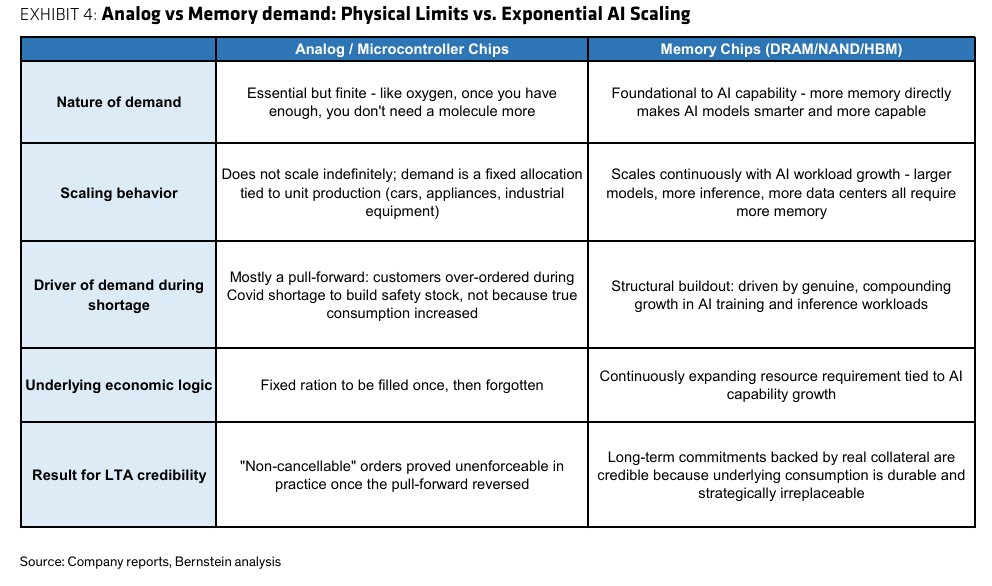
2/ Case 1, Microchip. The loose one everyone cites. COVID double-ordering inflated the backlog, Microchip's Preferred Supply Program locked in 12-month non-cancellable orders but posted no cash. Analog demand is finite, so once customers had enough they just stopped. Net sales fell 42% YoY and the program was quietly dropped. No teeth.
3/ Case 2, Hemlock. The one that had legal teeth and still failed. Solar makers signed 10-14yr take-or-pay poly at $40-60/kg, then China flooded supply and spot crashed below $15. Buyers defaulted rather than sell panels at a loss. Hemlock won in court but the counterparties went insolvent before paying. Legal teeth are worthless if collection takes years.
4/ What's different, part one. Real collateral posted upfront, not a promise. SanDisk has ~$69bn of remaining obligations backed by ~$11bn of guarantees on third-party balance sheets. Micron backs its book with $18bn of cash deposits plus $4bn of letters of credit. If a buyer walks, the supplier draws on cash already sitting there instead of suing for years.
5/ What's different, part two. The collateral is back-end weighted. Coverage rises toward 75-100% of remaining obligations in the outer years, so protection is strongest exactly when a downcycle is most likely to hit. The cushion gets thicker as the contract ages. Every prior LTA was the opposite.
6/ What's different, part three. Counterparty quality. Buyers are a handful of investment-grade hyperscalers, not thousands of thin-margin solar makers. Memory is a small slice of their earnings, so honouring the deal never threatens the business, and any shortfall is actually collectible.
7/ Why memory doesn't glut like analog. Analog is oxygen, once you have enough you don't want more, so it hit a ceiling and the glut followed. Memory scales with AI workload, every extra gigabyte holds more context, so demand compounds. The thing being gated is trillions in future revenue, so honouring the contract stays rational even in a downturn.
8/ The catch, and the note says it itself. Meaningful but not infinite protection. Near-term SanDisk numbers look high and face cyclical NAND downside, the disclosures have been confusing, and if NAND weakness turns structural the whole DCF resets lower. The floor is higher than 2022, not bulletproof.
9/ The valuation tell. PT $3,000 on 11x FY28 EPS. But the EPS path is $2.99 (25A) to $65.43 (26E) to $243.73 (27E). The whole target rests on those out-years being real, and the stock has already run. A re-rate that mostly happened, now it needs the earnings.
10/ Net. This is the serious rebuttal to "memory tops on great prices that stop accelerating." The LTAs don't repeal the cycle, they put a structural floor under the down-move that didn't exist before. The tape can still roll on decelerating beats while trough earnings sit far above the last cycle. Hold both. The back-end-weighted collateral is the piece to stress-test.
Morgan Stanley: Japan Electronic Components
1/ AI/DC component demand is real and still climbing, but MS isn't playing it as a rising-tide call. The whole deck draws one line, own the names compounding on product competitiveness, fade the ones riding opportunistic price hikes. In-Line industry view. The dispersion is the trade, not the theme. Murata top pick, Ibiden the short.
2/ The demand backdrop is not in dispute. Hyperscaler cash capex $460bn 2025 to $606bn 2026, MS 26E at $632bn, 4% above consensus, QoQ still rising into 4Q26. Everyone gets this. That's the point. The narrative names have already been paid for it, so the edge is in who keeps the earnings, not who has the exposure.
3/ Murata (6981) is the top pick, PT ¥12,500 vs ¥9,027, +38%. Value-added AI/DC MLCC mix, utilization 94% F3/26, OP roughly triples ¥432bn to ¥1,069bn out to F3/31. The MLCC ASP inflection is the leg, +11% 2026e after a decade of decline, and cap is tight. Consensus is 95% OW so the crowd is already here.
4/ The rest of the OW book is the same compounder logic. TDK (6762) +49% on batteries and HDD. Hirose (6806) +35% on industrial and AI server connectors. Niterra (5334) +23% on plugs, sensors, SPE chucks. Alps Alpine (6770) +47% on new smartphone camera actuators. All moat-and-mix, none of them the AI meme.
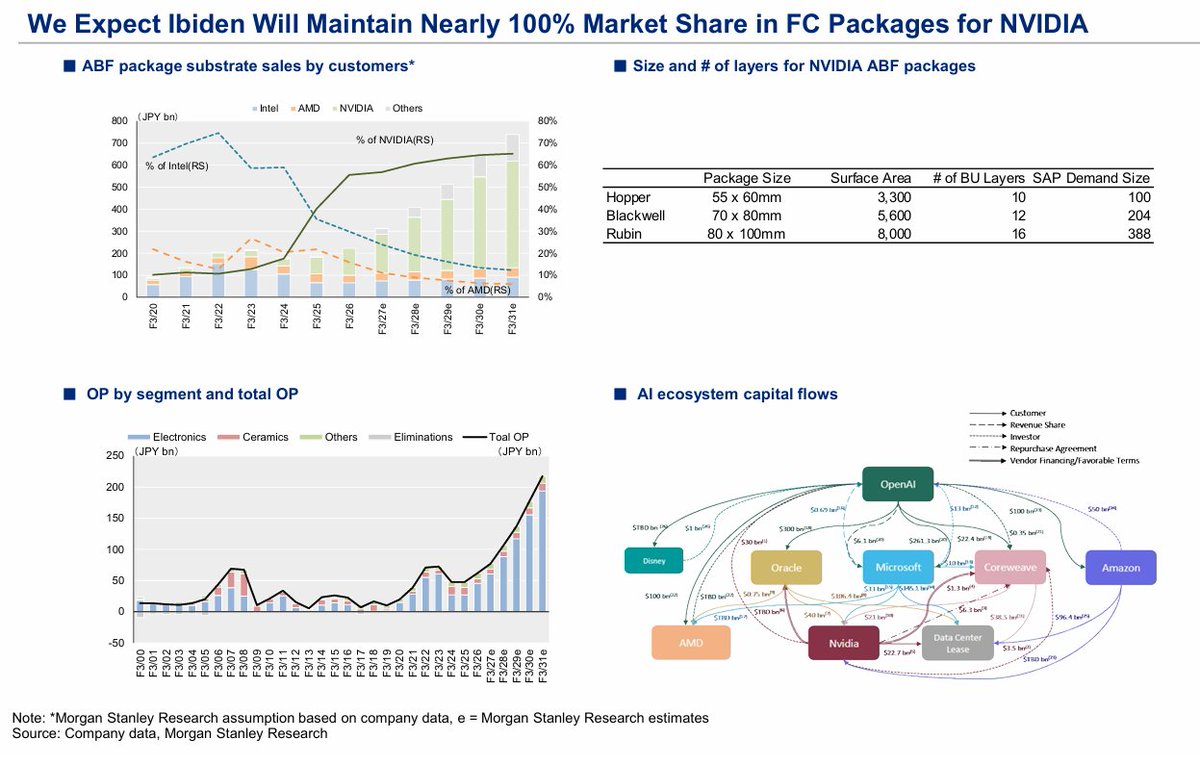
5/ Ibiden (4062) is the call worth stopping on. PT ¥13,000 vs ¥19,100, -32%. "Market's excessively high expectations likely to correct." MS is fading ~100% share in NVIDIA FC packages at 89.6x, right as Rubin scales package demand 4x from Hopper, 100 to 388, 10 to 16 BU layers. They aren't disputing the share or the demand. They're shorting the multiple.
6/ Taiyo Yuden (6976) is the other fade, PT ¥12,500 vs ¥14,965, -16%. "Even assuming continued earnings expansion, we view the stock as overvalued" at 66.8x. Limited mix upside from MLCC miniaturization. Nippon Chemi-Con -11%, Daishinku flat. The UW book is where the run outpaced the trajectory.
7/ The cleanest expression is a pair, not a single name. Murata OW vs Taiyo Yuden UW, same product, opposite call. Murata's AI/DC high-value mix and 40.8% share is the split from a name MS sees riding miniaturization but already overshot. And it's not fade-what-ran, Ibiden (+184%) and Taiyo Yuden (+323%) both led CY26 YTD and both are UW, but Murata ran +178% just as hard and stays top pick. The axis is valuation-vs-trajectory, not price action.
8/ Net. Demand is real, the market already paid for it, so MS is trading dispersion not exposure. Own Murata as the safe crowded expression, the actual edge is the Taiyo Yuden pair and the Ibiden short. The Ibiden UW is the one that ages very well or very badly, a -32% PT on a monopoly ABF supplier into Rubin, with bull case ¥25,000 sitting right there.
Note: a lot of these are consensus picks but you might find the MLCC+aluminum capacitor supply chain map useful to uncover some names. So many images in this report.