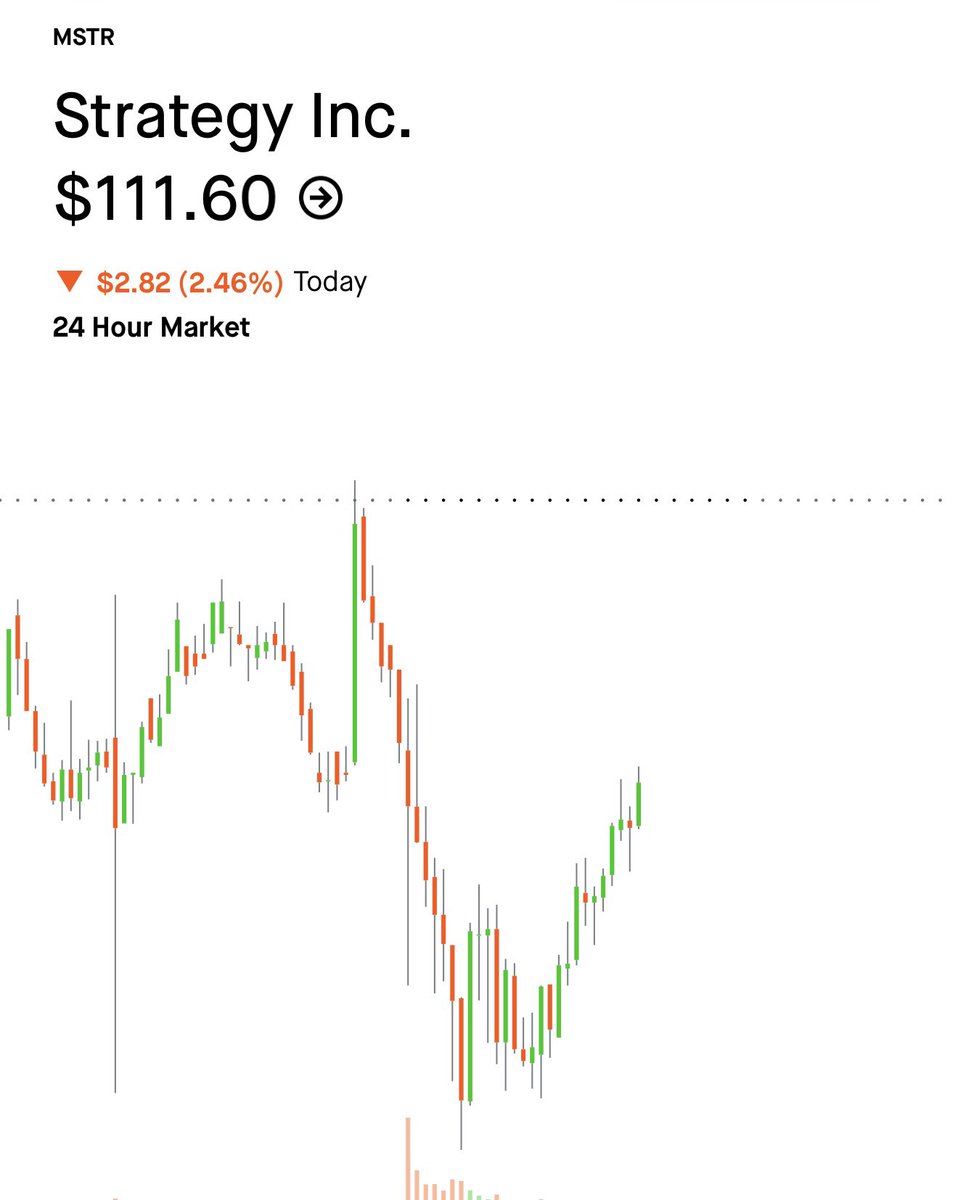
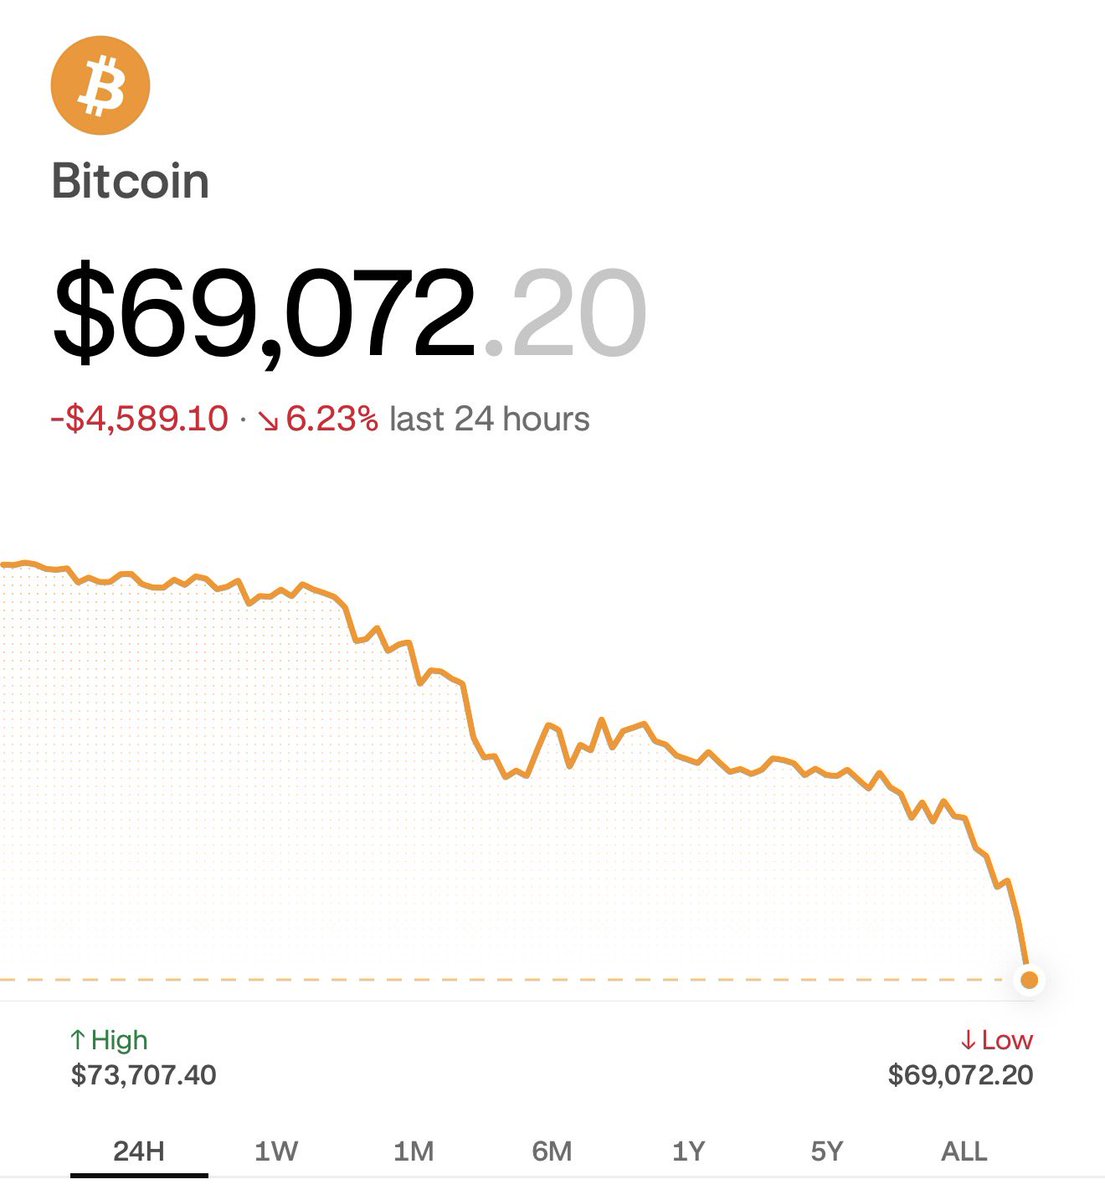
As BTC-TCs, both @Strategy | @Strive rely on robust capital markets access to scale the Treasury Model.
Through Digital Credit, they’ve opened additional capital-raising channels and, in my view, created a new asset class. The resulting preferred securities now trade as their own cohort | block in a secondary market, adjacent to $BTC and their “parent equities”, not separate from them.
My research at True North examines $STRC through that lens: buybacks, market structure, and the transmission channels connecting the offering to the wider complex.
This connection shows up in the data - the following results are from a broader analysis of all five preferred offerings: $STRK | $STRF | $STRD | $STRC | $SATA - using their price histories since inception and rolling attribution models built on matched trading sessions.
The results below are from a 9-4-26 snapshot of that larger analysis: a 60-session window spanning 6-11-26 through 9-4-26, covering the selloff, the pre-buyback rebound, and the buyback execution period.
Within that window, a model built on orthogonal (uncorrelated) factors explained 74.65% of daily price return variance in $STRC. The three largest allocations, expressed as shares of that explained variance, were:
a] Other (Non-STRC) Preferreds: ~44.7%
b] MSTR (ex-BTC): ~39.2%
c] BTC: ~15.7%
Read the full analysis here: https://t.co/cPIyEOnkeg
Depends on what leverage you are talking about and under what conditions.
Based on the data, the internal capital structure leverage in the form of preferreds doesn't matter much in terms of persistent drag.
However the positioning and leverage that builds up in the derivatives market matters substantially. You have derivative leverage building up on a derivative of a volatile asset. Some of that also being levered.
IMO trading below AV (Asset Value) or NAV is a function of that. [I used those two since they are persistent anchors as opposed to the shifting definitions of mNAV]
Remember:
When $BTC ⬆️ $MSTR ⬆️⬆️
When $BTC ⬇️ $MSTR ⬇️⬇️
It's not the ATM, and a share buyback won't prevent this.
As $BTC goes BTC-TCs ($MSTR | $ASST | $MTPLF) go. K?
While people will have you believe that $MSTR is down due to the ATM acting as a ceiling on price convexity, or that a $MSTR share buyback will raise price through driving scarcity, I'll keep giving you the logical, data backed answers. In simple terms:
When $BTC ⬆️ $MSTR ⬆️⬆️
When $BTC ⬇️ $MSTR ⬇️⬇️
Agreed. @nvidia | $NVDA IS @JensenHuang and based on the info available, this was a rash and forced decision. I don't see Jensen being out of the game for long. Maybe he could join A.I. Development at $AAPL because of their focus on Local A.I. or link up with @elonmusk
there is no replacing a founder like Jensen.
There never has been, and there can never be, a true succession for a founder like him. Nvidia ends today, and is replaced with a thing cosplaying nvidia. It will be run by custodians trying and failing to preserve the flame he ignited
While people will have you believe that $MSTR is down due to the ATM acting as a ceiling on price convexity, or that a $MSTR share buyback will raise price through driving scarcity, I'll keep giving you the logical, data backed answers. In simple terms:
When $BTC ⬆️ $MSTR ⬆️⬆️
When $BTC ⬇️ $MSTR ⬇️⬇️
Thats a fair question, and we should think it through. Ironically, this exact test (whether price tracks CEBE more tightly than gross BPS) is a good example of why proper quantitative | econometric controls matter.
This is something I considered in my analysis once I took a look at the structural differences between BPS and CEBE calcs when Strategy isn't buying $BTC or using the ATM.
To be specific:
Gross BPS = Total BTC / Shares no [$BTC Price] in the a fresh calc. it would be flat between filings.
CEBE (sats) = (Total BTC - (Net Senior Claims / [$BTC Price])) / Shares.
I'm highlighting this to show that even if denominated in sats, CEBE "contains" daily [$BTC Price] directly inside the senior claims formulation. Every day $BTC rallies without any balance sheet activity, (Net Senior Claims / [$BTC Price]) would shrink and CEBE ticks up.
So in a simple, unadjusted comparison against $MSTR share price, CEBE would actually appear to track price much more tightly than gross BPS. But that's not because the market is pricing the net common residual. It would be due to the fact that daily spot [$BTC Price] is within the CEBE formula.
When I think through how to orthogonalize CEBE against $BTC returns, I would have to "strip out" spot [$BTC Price] movement so I'm not just remeasuring $BTC. After that, the only variation left in CEBE is the discrete corporate action changes from share issuance, $BTC purchases, and debt | pref raises.
If you recall from my previous posts, those exact factors are already in my v20 models:
BPS explains 0.04%–0.33% of variance (p=0.34)
ATM issuance explains 0.24%–0.67% (p=0.34)
Preferred Flows move positively with the common stock (t= +4.92, p= 0.0000) rather than as a senior claim "drag".
I should note that this is evidence that also gets to the tension pointed out: if shareholders can't redeem the residual and nothing stops price from closing below that aggregate residual or trading at multiples above it; in what sense then is market valuation really "sitting" on that residual?
Outside of during an actual liquidation, the market isn't pricing any formulation of per share balance sheet changes at all. Everything still boils down to the equity tracking $BTC direction and the options | volatility complex directly.
So much noise in the space right now, about everyone favorite topic: the ATM.
Anyone making the unilateral claim that "ATMs cap the upside" on either $MSTR or $ASST is not operating from an informed position. Share issuance has data you can look into, model, and analyze for its impacts.
I promise you that the loudest voices screaming about share issuance have not done that work.
Firstly, I should note that my latest v20 models explain 72.8% to 85.2% of variance. Secondly, I find it interesting that (the A.I.) concedes the short term variance results (using outdated 63% R2 stats) and then pivots to an unproven "longer term structural effect” that depends on BPS or CEBE being the factors that set value or the multiple.
However, there are a lot of flaws there, specifically around the claim that dilution effects reducing BTC per share (or CEBE) lowers the mNAV or the price for any given total NAV, even if it doesn’t show up in the regression. Also, declines in BPS and mNAV “compression” are used as evidence of a structural effect that my variance work can't account for.
Ironically, BPS has been one of the most consistently modeled factors in my work and I think the A.I. is assuming that BPS | CEBE are valid metrics for what the market is pricing; or for the “residual claim” the market is valuing, but they aren't.
After today's latest run (with a fresh as of 10-30 date), when assessing BPS growth as a factor across all models from 2021 to 2026, its price variance contribution is just 0.04% to 0.33%.
Getting more specific, in my full Capital Structure model (which explains 85.2% of price variance), the variance contribution from BTC Per Share is 0.04% (+R2=0.000) and it is statistically insignificant (t=-0.948,p=0.3438 ), just as the ATM itself is statistically insignificant (t=0.961,p=0.3375 ) with a 0.67% attribution.
Even in the broader 2021–2026 models where BPS shows significance, the t-stat is negative (t=-5.73 to -7.01) which in plain terms means that generally, as BTC Per Share went up, share price went down. I think that is a rather concrete answer about whether or not the KPI shows up as some missing long-horizon driver of price.
@Strategy itself has defined BTC Yield as a narrow KPI for per share accretion on $BTC holdings and has repeatedly stated that it isn't a measure of valuation, financial performance, or returns.
Specifically, Strategy’s own Q3 2026 financial release (filed October 29, 2026) explicitly states in its KPI disclosures that BPS (in Sats) "does not represent (i) the Company's ability to satisfy its financial obligations, or (ii) the Company's book value per share" and that BTC Yield "is not a measure of the return on investment the Company's shareholders may have achieved historically or can achieve in the future by purchasing stock of the Company".
BTC Per Share is essentially an accounting reality that doesn’t represent a redeemable claim nor a redeemable residual after senior claims.
If we move onto CEBE; this is an attempt to net out senior claims, but it serves as just another formulation of the same accounting residual and is not what the market is forward pricing. Based on years of analysis what I see tells me that the market is pricing the BTC capital base, the optionality within the equity, the adversarial positioning around the equity and the sentiment | positioning around the resulting structure (mNAV). With mNAV acting as a multiple that is assigned independently of the current BPS | CEBE reality. I think this is somewhat evidenced by persistent rises in BTC Per Share (for many BTC-TC’s) while share price fell.
Now the question that I have is this: If the company that created the metric, defined the metric, and was the first to consistently report the metric, is saying that it's not a measure of valuation or related to stock price performance; perhaps there is a reason for that. No? At the same time @saylor himself has described mNAV expansion as driven by market sentiment | confidence, with BTC Yield and BPS rising as a result of that sentiment rather than being its cause. The data, the results of my modeling, and the official corporate framing are well aligned.
Coming back to the analysis that I have done in more detail, the modeling isn't a simple “correlation” analysis and it isn't missing a slow structural effect that is captured in BPS | CEBE or dilution effects .
Rather, using orthogonalized factors, Newey-West HAC standard errors, rolling 90D | 180D Shapley windows, and BVAR sign restrictions, its showing that the factors that actually move price variance are overwhelmingly $BTC direction (accounting for 41.2% – 51.2%), followed by options positioning (GEX, DEX, Max Pain Distance, PCR), shorting pressure and related positioning, volatility (VIX and MSTR IV), volume (Turnover vs. ADV), capital rotation ($BTC Miners, Spot ETFs, and Mag 7), and the preferred capital structure ($STRK, $STRF, $STRD, and $STRC).
The ATM is simply noise inside that process (0.24% to 0.67% of variance, even when tested across 5d, 10d, and 20d rolling sums) and that is consistent over days, weeks, months, and now years.
In the face of all of that, to treat a change in an internal KPI as the missing long horizon driver we would also have to use the same investment framing and metric that the company itself already excludes as valuation, and the market pricing process doesn’t reinforce.
By the way, I should note that the money printing comparison is a common one that doesn't really fit or apply here. Money printing expands the supply of the unit of account against a relatively fixed base. The ATM is issued against available liquidity that is then used to acquire more of an underlying asset; which isn’t really an expansion of the monetary base. Yes, the ownership percentage of an existing share falls, but the economics of that share depend on what the company receives and does with the proceeds. But I think this is making the same assumption that the share count is the scarce unit and that the market capitalizes a per share claim, but there is no evidence of that in the observed data or price trends.
Finally, yes, an artificial buyer or seller can move the price, that is obviously true for individual trades, and my work never denied that. What I tested was how much issuance (and also buybacks) explain price variance over various time frames once I account for $BTC and include other factors. What I found was that “other factors” overwhelmingly dominate. So claiming otherwise is arguing against a claim I didn't make.
@mikewmunz@chcbearsfan The original answer, when I first started investing in it was the correct one: $BTC ⬆️ $MSTR ⬆️⬆️ thus $BTC price action and all the layered optionality it brings via $MSTR is what matters.
I've been trying to help people understand that the market isn't pricing this equity based on BPS.
It's the optionality and directional exposure to $BTC.
Re: the common stock ATM point? I have years of data and analysis behind my comments on it. For me, it isn't a matter of opinion, its a matter of evidence and the evidence is clear.
mNAV will expand again if and only if $BTC has a real run. That is the driver, $BTC and total $BTC holdings and the directional exposure and potential outperformance they bring.
The shares and the volatility they expose market participants to are the product and the value prop, not the sats per share.
@PunterJeff Let the waters boil.
I'm using it to architect something new and it actually gave me an idea I hadn't considered (in over 6 months of tinkering).
Different angle, but yes, if sats per share is the metric you are tracking that is one lens.
My point is that $MSTR | $ASST specifically they are indistinct from zero in terms of price impact along multiple time horizons. And there is no evidence that more shares dampens convexity | upward movement.
The shares and their volatility are the product and issuing shares is the business model.
Companies that repurchase their stock with cash weaken their business. Those that buyback stock with debt actually impoverish their business. #Bitcoin on the balance sheet is a rational alternative that strengthens a capital structure to the benefit of all stakeholders.
@TheBitcoinETF@Giovann35084111 It's because he likely plagiarized the concept of the Bitcoin Power Law, reworked it as his own, and thus can't defend it with the level of skill and adaptability the original author | creator would have. But that's just a working theory...