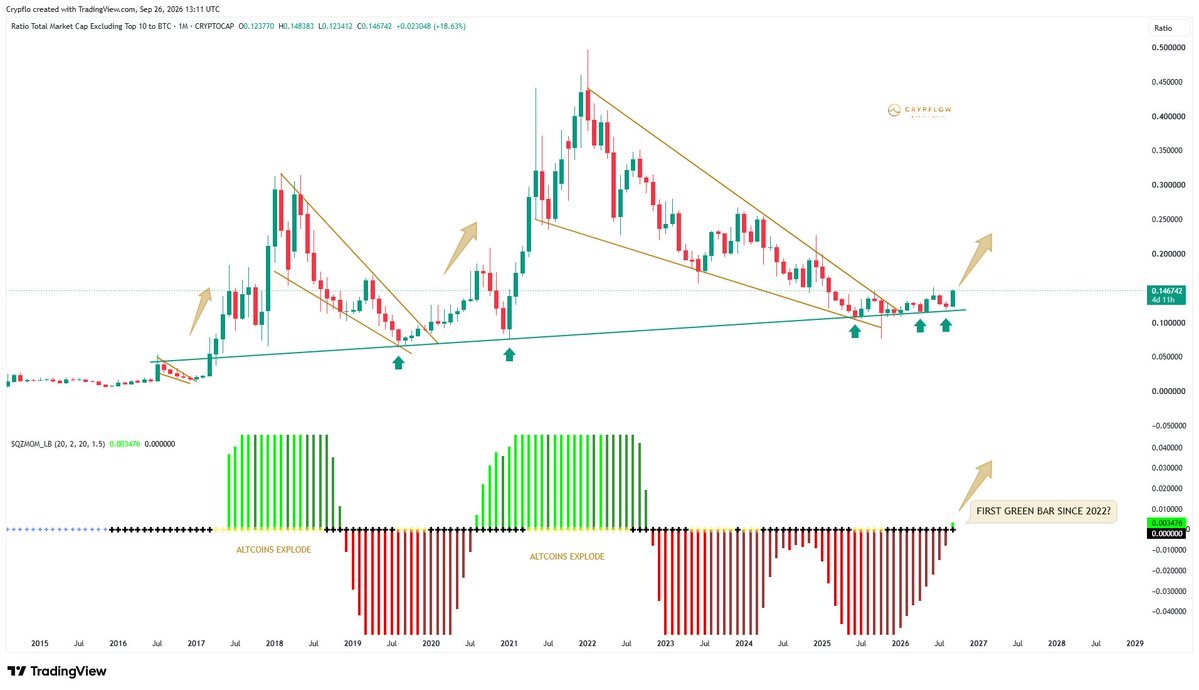
$OTHERS/BTC (1M) – This is massive. 👀
Back in March, I said two things had preceded the last major altseasons:
→ OTHERS/BTC breaks out
→ Squeeze Momentum turns green
The breakout already happened.
And now we’re seeing the first green momentum bar forming since 2022.
Only 4 days left until the monthly candle closes.
Look at the previous times this happened.
2017 → altcoins exploded.
2021 → altcoins exploded.
After 4 years of Bitcoin dominance, the same conditions are starting to line up again.
You might not be ready for what comes next. 🌊
OTHERS/BTC (1M) - The signal that started the last 2 altseasons is forming again.
Zoom out.
Every major altcoin expansion started the same way:
🔹OTHERS/BTC breaks out of a falling wedge
🔹Squeeze Momentum turns green
When those two align, altcoins start massively outperforming Bitcoin.
2017 🚀
2021 🚀
But this cycle was different.
After the 2021 peak, the Squeeze Momentum stayed red for years.
That meant:
🔹Prolonged Bitcoin dominance
🔹No real altseason
Now something interesting is happening.
OTHERS/BTC just broke out of another multi-year falling wedge.
And momentum is rising again.
If the Squeeze Momentum flips green, the same conditions that triggered previous altseasons could return.
And when that happens…
The biggest moves usually start when nobody expects them.
🚨 Wave Report #29 just dropped
BTC has tested $62K. I remain bullish long term, but a higher low still needs confirmation.
Can Bitcoin build a base here, or does the June low face another test?
Four charts. Key levels. Two scenarios. 👇
https://t.co/BHXIRonhvv
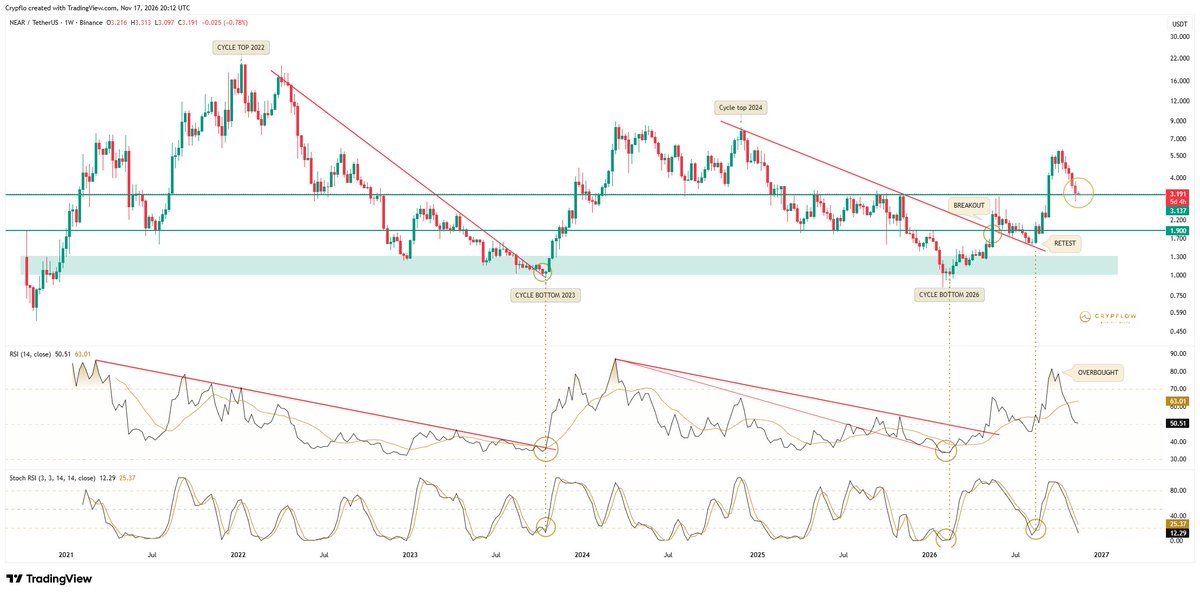
$NEAR (1W) - Nice spot for a bounce.
NEAR is back at the $3.1 area, which has acted as an important level before.
At the same time:
RSI has cooled back toward 50.
Stoch RSI is almost fully reset.
And the bigger breakout structure is still intact.
If this level holds, I think NEAR has a good chance of bouncing from here.
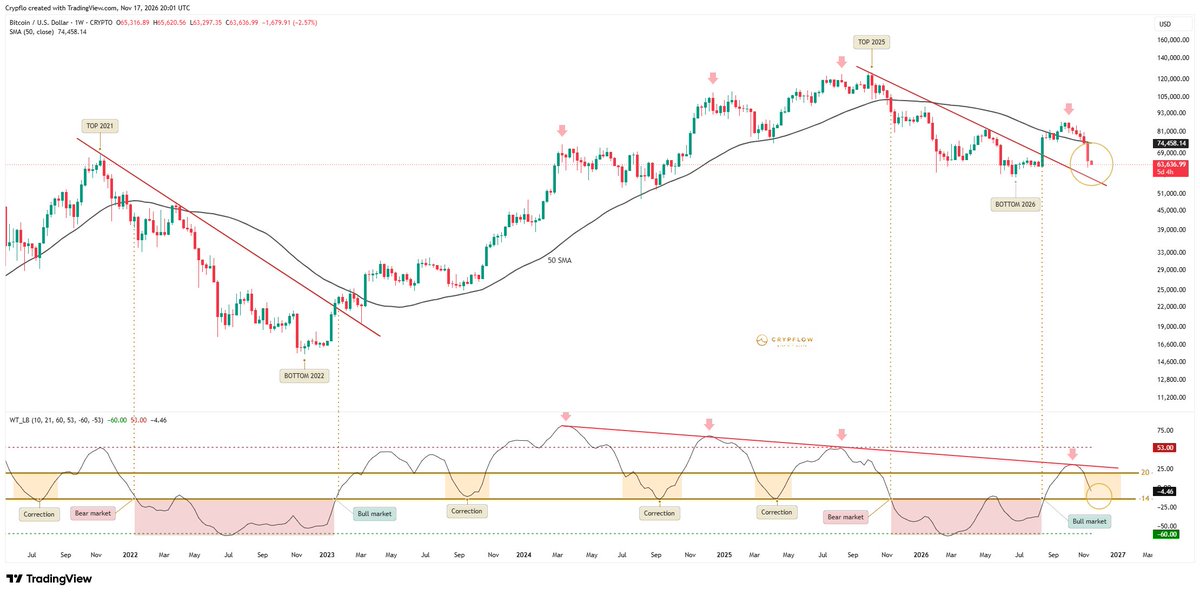
bitcoin:native (1W) – Watch -14. 👀
WaveTrend spent around 280 days below -14.
Then it finally reclaimed it and pushed higher.
But that move got rejected right at the long-term downtrend. The same one that marked every local top during the previous bull market.
WaveTrend has now dropped below 20 and is falling back toward -14.
That’s the level I care about.
Hold it and the bullish trend survives.
Lose it and we need to reassess.
@DavidBreault10 That’s exactly how I’m looking at it too.
Not trying to nail the perfect bottom, just adding when the higher-timeframe setup gives you an amazing opportunity.
$BTC.D + $ETH.D + $USDT.D + $USDC.D (1W) – Back at the ceiling.
This combined dominance has been rejected around the same 81–82% area again and again.
And every time it finally loses that zone and rolls over…
altcoins get room to run.
Right now we’re back at the ceiling.
If this starts breaking down from here, I expect capital to rotate back into the rest of the market fast.
The level I’m watching after that is 74%.
$USDT.D (1W) – There’s the bounce.
A few weeks ago, I said USDT dominance could bounce back toward 8% before the bigger breakdown starts, just like it did last cycle.
That’s exactly what happened.
Now USDT.D is back at major resistance.
RSI is also pushing into its downtrend.
Last cycle, this is where dominance got rejected and crypto got room to run again.
And remember:
Above 8% USDT.D is where I want to be loading up on Bitcoin and alts.
The bigger picture hasn’t changed for me.
If USDT.D rolls over from here and eventually loses the 6% support, it’s game on for crypto. 🌊
$USDT.D (1W) – One more bounce first?
USDT dominance is reacting from support and Stoch RSI is crossing bullish from the lows.
So some short-term pressure on crypto wouldn’t surprise me.
If the previous cycle keeps rhyming, USDT.D could push back towards the 8% area before the bigger breakdown starts.
For me, that wouldn’t be a bad thing.
That would give us another window to add to altcoin positions at better prices.
The bigger picture hasn’t changed.
Lose support after that and it’s game on for crypto. 🌊
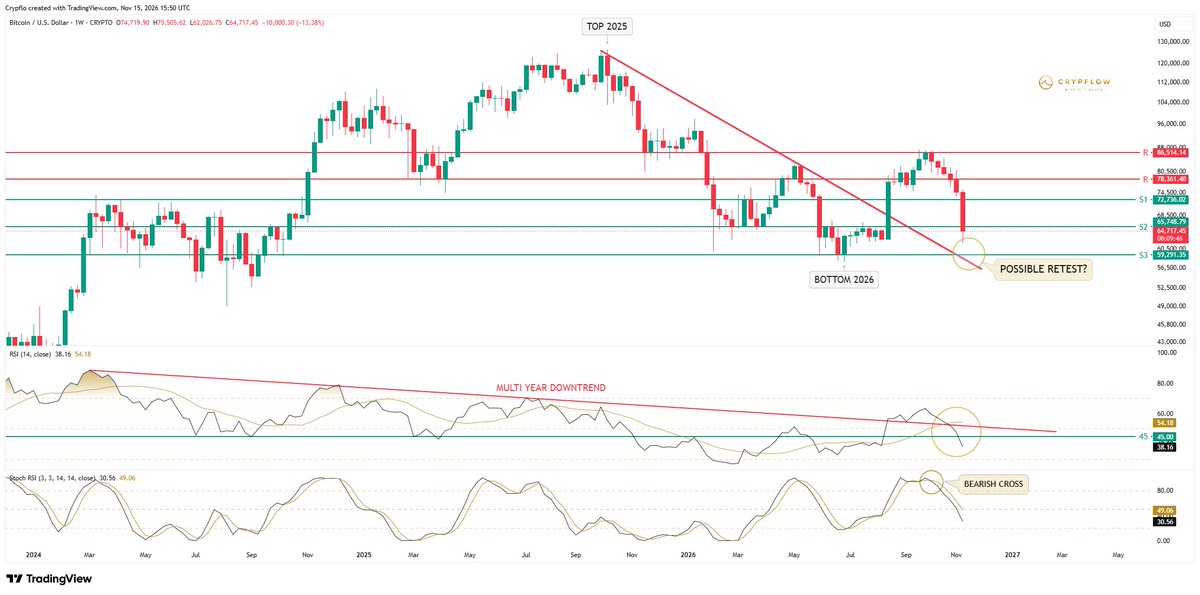
$BTC (1W) – This weekly close matters.
BTC is just hours away from losing two major support levels in the same week.
S1 is already gone.
If BTC also closes below S2, I think another leg lower becomes very likely.
The next area I’m watching is pretty clear:
The broken multi-year downtrend + S3 around $59K.
That would also line up with a possible retest of the downtrend before the next expansion.
Momentum on Stoch RSI still points lower.
Weekly RSI has also lost 45 as well, this is the level that held every major correction during the previous bull market.
If BTC drops into that lower area, the structure could shift from an inverse head and shoulders into a double bottom before the next major move higher.
If S3 holds first, the inverse head and shoulders could still remain in play, just with the right shoulder forming lower than I initially expected.
Short term: more downside risk.
Big picture: still bullish. 🌊
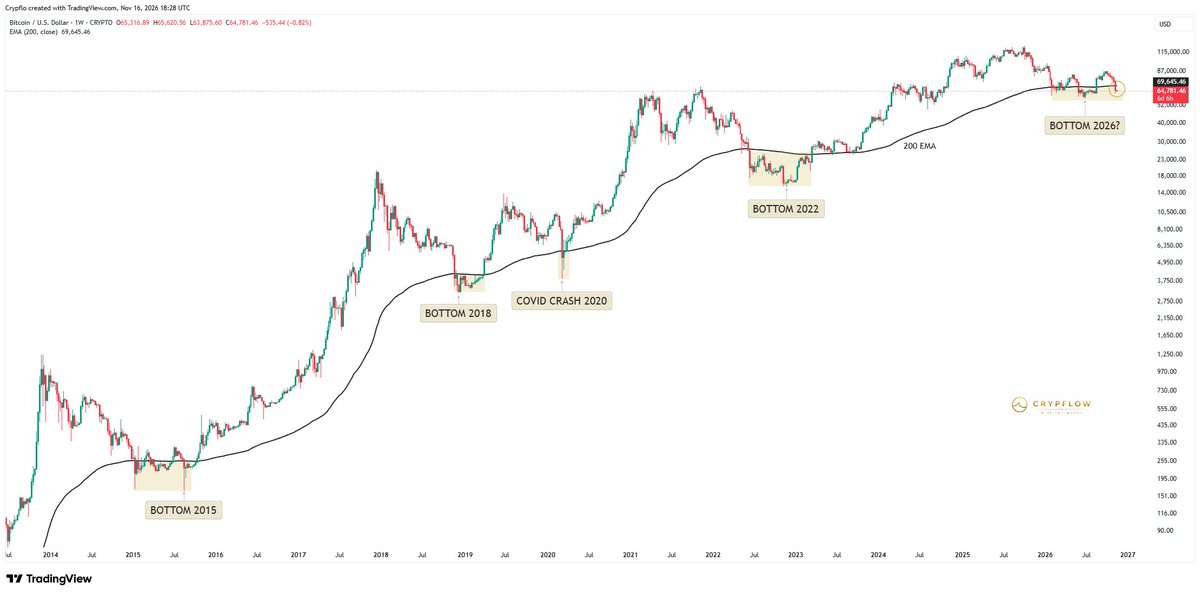
Didn’t expect BTC to drop this low, to be honest.
The 50-week SMA has only been lost once after a confirmed reclaim, and that was during the Covid crash.
I’ll share my updated view and what I expect over the coming months in a post.
I’ll also cover it in detail in tomorrow’s newsletter.
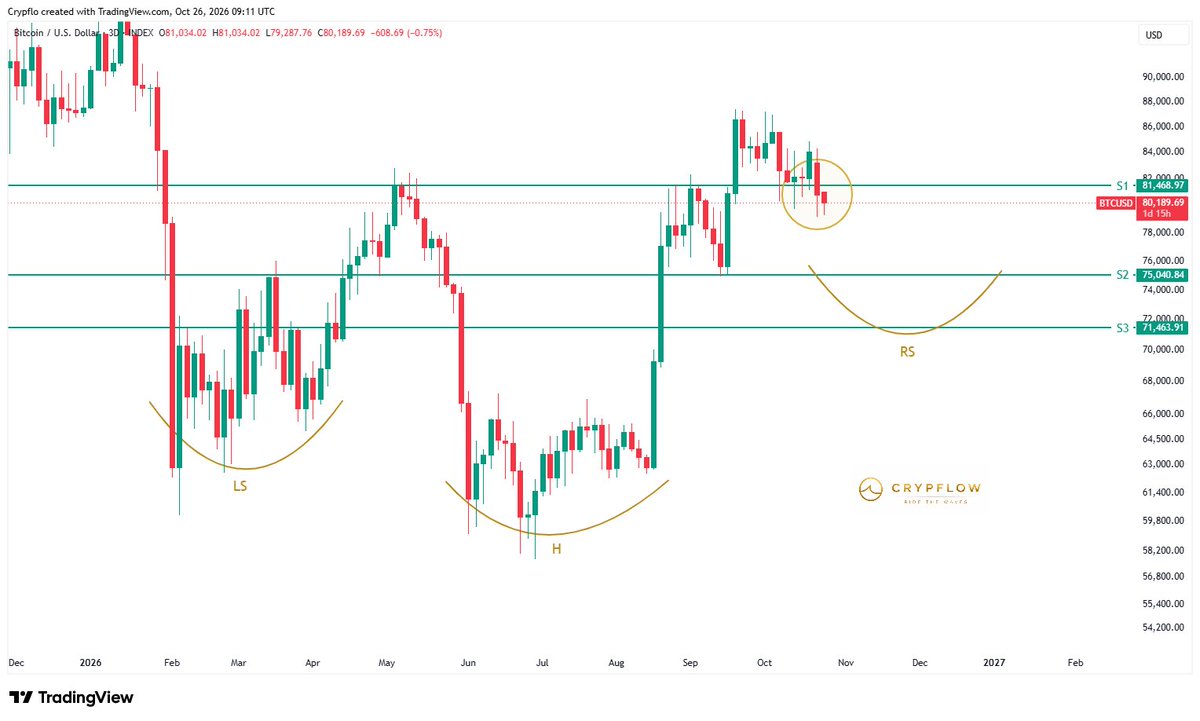
$BTC (3D) – This is what I’m watching next.
I’ve been talking about a higher-timeframe cooldown for weeks.
I still think the bigger trend is bullish and the bottom is in.
But in the coming weeks I’m expecting a deeper reset.
Something like this would make a lot of sense:
Right shoulder forms.
Momentum resets.
Then the next leg higher begins.
$75K–$71K is the area I’m watching.
I already have buy orders waiting at S2 and S3.
Don’t fear the pullback.
Prepare for it.