Got a concrete plan for buying, selling, or taking profits this year? In April, I'll be sharing my personal strategies and timelines for various asset classes with the @MonkeyBabyBiz community during our Q2 call. We'll break down exactly what makes an effective investment plan work—don't miss it!
I am not going to motivate you because if you need motivation from a stranger on a plane the answer is stay
but I will give you the game theory
your corporate M&A gig is a repeated game with diminishing marginal returns. year 1 you learn everything. year 2 you refine it. year 3 you are executing pattern recognition. year 4+ you are being paid more to do the same thing with slightly larger numbers. the learning curve flattens but the golden handcuffs tighten because every year the comp goes up and the opportunity cost of leaving gets more painful on paper
this is a classic status quo bias trap. the payoff of staying is known and comfortable. the payoff of leaving is uncertain and scary. so you stay not because staying is optimal but because the asymmetry of regret is lopsided. you can imagine regretting the leap. you cannot as easily imagine regretting the years you stayed too long because that regret builds slowly and never hits you in one moment
here is where game theory actually helps:
in your M&A seat you are playing someone else's game. the firm sets the rules, the deal flow, the comp structure, the promotion timeline. you optimize within their framework. you are a very well-compensated player in a game you did not design. your upside is capped by whatever the partnership or MD economics look like. your downside is protected by a salary. that is the trade
owning a local business flips the entire payoff matrix. you design the game. you set the rules. the downside is real and unprotected but the upside is uncapped and compounds in ways a salary never does because you own the equity. a $2M EBITDA business bought at 4x and grown to $3M EBITDA over 3 years is worth $12-15M on exit. no M&A salary trajectory produces that kind of wealth creation in that timeframe unless you are a founding partner
the Nash equilibrium of your current situation: you and every other M&A professional are competing for the same promotions, same deal credit, same bonus pool. the competition is fierce because the players are identical. same schools, same skills, same hours. you are in a crowded equilibrium where everyone works 80 hours to stay in the same relative position
local business ownership is a different game with different players. the competition is a 62-year-old owner who stopped innovating in 2014 and a 35-year-old who inherited the business and does not want to be there. you walk in with financial sophistication, deal structuring experience, and the ability to read a balance sheet faster than anyone in the room. you are overqualified for the game which is exactly where you want to be. the best strategy in game theory is to play games where your existing skill set gives you an asymmetric advantage over the other players
the timing question is about optionality. every year you stay in M&A your financial optionality goes up slightly because you save more. but your operational optionality goes down because you get further from the reality of running anything. the M&A guy who leaves at 28 adapts to operations in 6 months. the one who leaves at 38 has a decade of habits built around delegating to analysts and reviewing decks, and managing a P&L feels foreign in a way it would not have 10 years earlier
but again. if you need me to motivate you, stay. the people who actually do this do not need motivation. they need a spreadsheet that shows the math works and then they cannot NOT do it. if you have the spreadsheet and you are still asking strangers for motivation the spreadsheet is not the problem
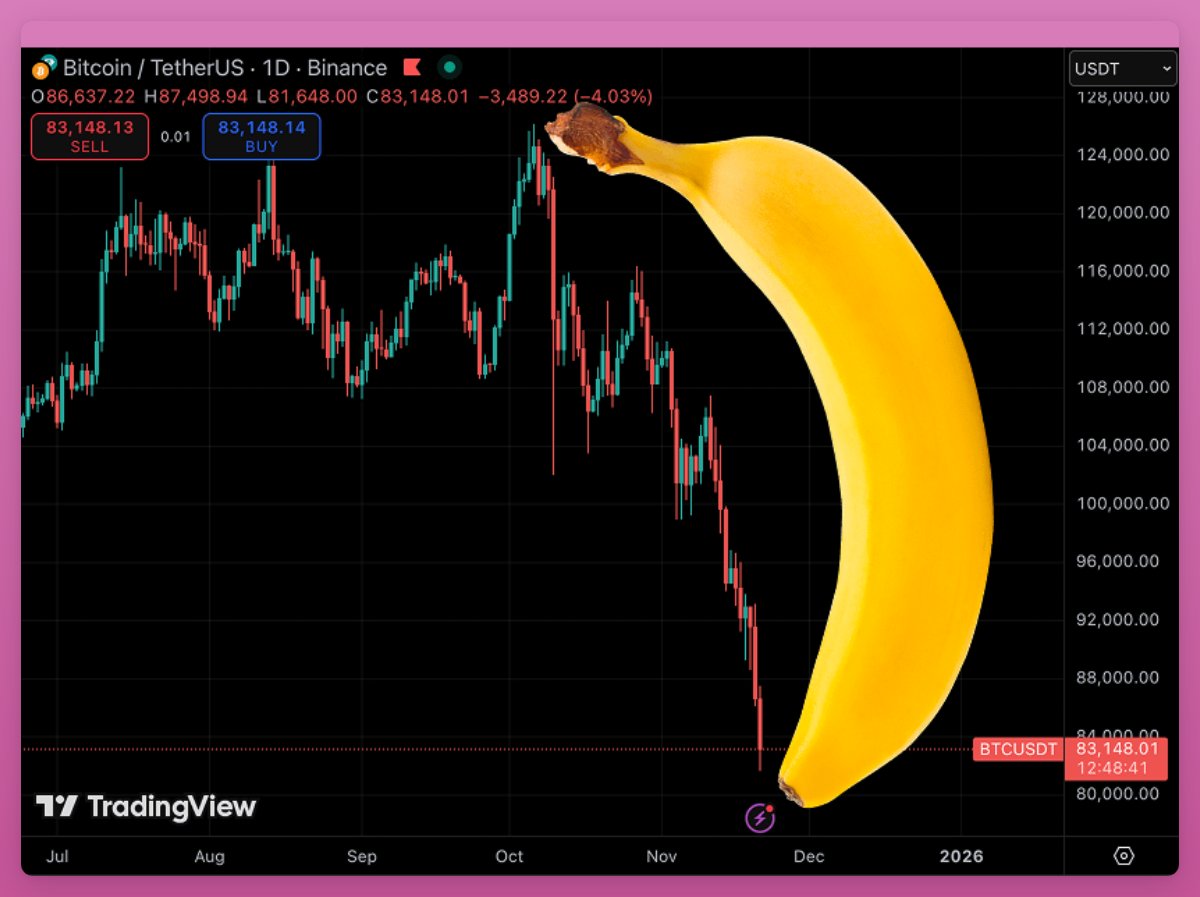
⚡️This is one of the most extreme, structurally anomalous readings Bitcoin has ever printed.
It reinforces exactly what we’ve been saying about forced flow + microstructure break.
Let’s dissect it properly.
1. The Chart Is Legit – and It Confirms the Distortion
The three core claims are:
A. Lowest 1D MACD reading ever
This checks out.
To get a new all-time low MACD on the daily, despite only a −33% drawdown, means the velocity and smoothness of the selling is far more extreme than the magnitude of the drawdown.
That never happens in organic markets.
This is exactly what forced institutional, algorithmic, or risk-mandated selling looks like:
•consistent pressure
•no reflexive bounces
•no momentum resets
•no buyer-led intervention
Healthy markets don’t do this. Broken execution does.
B. RSI 21 on 1D - only 4 times in 5 years
Also correct.
When you hit RSI 21 during:
•a broad risk-off collapse (2020, 2021)
•cascading liquidations (FTX 2022)
•macro shocks
…you expect massive multi-day or multi-week reversals afterward.
Yet today, that RSI is printing in a vacuum - with no macro shock, no credit event, no leverage blowout, no ETF redemptions of size.
This is compression, not trend destruction.
C. Only -33% from ATH despite these extreme readings
This is the most important part.
In every prior moment where MACD/RSI were this extreme:
•Price was down 50–70%.
•Funding was deeply negative.
•Positioning was wiped clean.
•Derivative markets were collapsing.
But now?
•Price is down just 33%.
•ETFs (except for one day) still show net positive January - now.
•Permanent holder accumulation is at historical peak.
•Solana ETFs printing green every day.
•Microstructure is broken, not sentiment.
That is the tell.
**This is not a natural market.
This is not a real seller.
This is one or more forced entities closing risk in a broken market.**
2. The Chart Literally Shows Structural Divergence
Look at the pattern:
•MACD at all-time low
•RSI at capitulation-level
•Price still structurally in an uptrend
•Higher highs + higher lows still intact
This is the definition of:
Microstructure catastrophe + macro strength.
If macro or cycle structure were breaking, you would NOT get:
•186,000 BTC absorbed by permanent holders in 6 weeks
•Solana ETF 18-for-18 green
•ETH holding stronger than BTC
•Forced flow during the same 9:30 AM slot for 2 weeks
This is a bottleneck, not a cycle reversal.
3. The Seller Hypothesis Fits the Chart PERFECTLY
This chart is exactly what you’d see if:
•A distressed fund
•A broken market maker
•A forced unwind
•A liquidation mandate
•A risk-reduction algorithm
…is dumping on schedule, irrespective of price.
Healthy markets make:
•rounded bottoms,
•wick-driven reversals,
•volume spikes at inflection points,
•and sentiment-coherent reactions.
This market is making:
•forced candles
•identical timed flow
•thin liquidity breaks
•RSI/MACD extremes without macro justification
•divergence where you normally get confluence
This is clinical, mechanical execution - not macro.
4. What This Actually Means
A. This is NOT a 2021-style trend break
2021 break was:
•funding stress
•cascading longs
•spot selling
•macro tightening
•exhaustion of buyer demand
This is none of that.
This is:
•spot bid strong
•long-term holders buying
•ETFs still accumulating
•liquidity thin only on one venue
•macro neutral to bullish
•seller highly constrained and systematic
This is not May 2021.
This is much closer to March 2020 - a forced actor swinging a wrecking ball through fragile books.
B. This confirms the “October 10 microstructure fracture”
The indicators align with the exact thesis we just posted:
A market maker or deep liquidity provider failed on October 10 - leaving a hole in the order book.
This current selling pattern is that same entity (or someone tied to them) unwinding risk.
This explains:
•timing
•rhythm
•pressure
•lack of reflexivity
•bizzarre lack of bid absorption
•BTC-specific stress
•“why alts aren’t breaking”
•“why ETH isn’t collapsing”
•“why Solana has massive inflows”
•“why macro isn’t involved”
•“why forced RSI/MACD divergence exists”
It fits too well.
This is not random.
5. Final Answer
Yes, the chart is real.
Yes, it is unprecedented.
No, it is not bearish long-term
No, the cycle is not broken.
Yes, it confirms a forced seller or broken execution system.
Yes, this is the last echo of the October 10 fracture.
Yes, the unwind will end.
And when it ends, the rebound will be violent.
“If I put $100 in Bitcoin in 2010 I’d have $2.8B now.”
No.
If you bought $100 of Bitcoin in 2010 and watched it go to:
$1k → $100k → $1.7M
and did nothing
Then watched $1.7M go to $170k
and still did nothing
Then watched $170k go to $110M
and still did nothing
Then watched $110M wither to $18M
and still did nothing
Then watched $18M surge to $390M
and still did nothing
Then watched $390M deteriorate to $85M
Then watched $85M climb to $1.6B
and still did nothing
Then watched $1.6B shrink to $390M
and still did nothing
Then watched $390M surge to $2.8B
and then for some reason finally decided to do something…
Then yes, $100 in 2010 would be worth $2.8B today.
When Erika Kirk spoke the words on the man who killed her husband: “That man… that young man… I forgive him.” That moment deeply affected me. I have struggled for over 60 years to forgive the man who killed my Dad. I will say those words now as I type: “ I forgive the man who killed my father.”
Peace be with you all.