$BTC hasn’t bottomed yet and the current price action clearly doesn’t reflect a typical market low.
When markets form a bottom, we usually see aggressive sell-side pressure, repeated sweeps of the lows, and clear signs of capitulation.
That’s not what we’ve seen so far.
There are still multiple unswept lows below, and the majority of liquidity remains positioned to the downside.
Looking at the HTF picture it also becomes clear that we're still trading within a macro downtrend, with no clear shift in momentum.
At the same time, sentiment is already starting to turn bullish again — which typically happens before another move lower, not at the actual bottom.
All of this suggests that the market hasn’t gone through the kind of conditions you would expect at a true low.
As long as these factors remain in place, I expect price to continue lower and eventually take out the remaining liquidity below.
A confirmed shift in structure and a reclaim of key levels would be the first sign that this view is wrong — but until then, the downside remains the more likely path.
$BTC
Here is what my spot investment strategy currently looks like.
I have already started accumulating BTC around $65k and plan to continue building my position if price moves lower.
While I still expect a sweep of the lows before the bottom is fully in, I believe current prices already offer attractive long-term value from a spot investment perspective.
My main scenario remains a move into the $60k-$54k region.
This is the area where I expect the bottom to form and where I plan to deploy the majority of my remaining capital.
That said, trying to perfectly time the exact bottom is not my goal.
Instead, I prefer scaling into positions as price moves deeper into areas where I believe BTC is becoming increasingly undervalued.
If we continue lower, I will simply view it as another opportunity to accumulate more spot at better prices.
Once the market eventually transitions back into a bullish trend, the difference between buying at $65k and $58k will likely matter far less than having built a meaningful position near the bottom.
$BTC
After the recent selloff, price has finally started to stabilize at a major HTF support level.
Funding remains positive, showing that perp traders are still heavily leaning long despite the correction.
At the same time, open interest is sitting near the highest levels we've seen all cycle, meaning a significant amount of leverage is still in the market.
The one positive change is that spot has stopped selling aggressively for now.
As long as spot demand continues to improve, a short-term bounce from this area becomes increasingly likely.
The main question is whether spot buyers can maintain control long enough to force a larger squeeze higher.
$BTC
This is actually wild.
The current liquidation map shows one of the largest imbalances we've seen in a long time.
More than $17B in short liquidations are currently sitting above price, while only around $1.5B in long liquidations remain below.
That creates an imbalance of more than 11:1.
From a liquidity perspective, a bounce would therefore make a lot of sense.
Such a move would not only clear out some of the liquidity that has built up overhead, but also allow liquidations to build back up below before the broader downtrend continues.
$BTC
In the end, it was the exact same pattern that played out three separate times throughout this cycle.
Price formed a range where we saw at least 2-3 months of sideways price action before BTC eventually broke above the highs.
This is where buyers got baited into a false breakout before we saw the next larger leg down.
What's interesting is that every deviation above the range highs was followed by a rejection back into the range, completely invalidating the breakout.
We're now seeing the same thing for the third time.
Price failed to hold above the range highs, re-entered the range, and has already started accelerating to the downside.
The previous two deviations both marked the beginning of a much larger correction. So if this pattern continues to play out as it did before, the current selloff may only be the beginning.
$BTC
This is actually insane.
There is a massive bid wall sitting right below price between $65k and $66k.
These bids line up perfectly with a major support level where buyers have stepped in countless times in the past.
Because of that, I believe this could be the level where we see a short term bounce before BTC continues its downtrend and eventually sweeps the remaining lows.
$BTC
After two months the CME gap at $67k has now been filled.
This means that all active CME gaps are currently sitting above price.
While this removes one of the most obvious downside targets, it doesn't change my broader view.
As long as HTF structure remains bearish, I still believe a sweep of the lows is likely before we see a larger trend reversal.
$BTC
The monthly open played out differently than expected.
Instead of seeing the typical push higher at the start of the month, June has opened with strong downside momentum.
Looking back over the past 10 months, this has only happened twice before. In both cases, BTC went on to correct by at least 25% from the monthly open.
If June follows a similar path, a move into the unswept lows becomes increasingly likely, as a 25% correction from the
monthly open would put BTC near the $55k region.
Considering that BTC has now re-entered the previous range and is still in a macro downtrend, a move toward the unswept lows below would not be particularly surprising.
$BTC
June is about to open with a scam pump and here’s why.
Over the past 10 months, the vast majority of monthly opens have been followed by a push higher before weakness sets in later throughout the rest of the month.
The only exceptions were November and February, where the previous month already ended with a dump and downside momentum simply carried over into the new month.
This time around, the setup once again supports the possibility of a move higher.
The recent selloff has created large amounts of liquidity above price, making a squeeze into the monthly open increasingly likely.
A move back into the recent breakdown levels would not only clear out that liquidity, but also provide the chance for a proper retest before continuing lower.
That said, I still believe any strength at the start of June is likely to be temporary and eventually turn into a bearish retest rather than the beginning of a new uptrend.
My Next $BTC Plan
Bitcoin has now officially re-entered the old range.
With yesterday’s daily candle, price closed back below $73.5k, confirming the loss of the most important support level.
Holding above this area could have opened the door for another move higher. Instead, the failed breakout has shifted market structure back in favor of the bears.
My plan from here is simple.
I’ll be watching for a retest into the $74k-$76k region. This area previously acted as support and should now turn into
resistance.
If price respects that level and starts showing signs of rejection, I’ll be looking to open a short position targeting the unswept lows below.
As long as BTC remains below $76k, I believe a sweep of those lows becomes increasingly likely over the coming weeks.
The invalidation for this idea sits at $79.5k, which is right above the next key breakdown level and would significantly weaken the bearish case.
$BTC
Price continues to slowly trend lower while funding remains highly positive.
At the same time, open interest started increasing significantly again as soon as the markets reopened, showing that new positions are entering the market despite the recent selloff.
What makes this especially concerning is that spot has started selling again after briefly stabilizing over the weekend.
In other words, we're once again seeing spot pressure to the downside while perp traders continue leaning long.
For now, the market still appears heavily dependent on perps while spot demand remains absent.
As long as that doesn’t change, I don’t see a strong case for a sustained move higher.
$BTC
As expected, May closed red.
This was the 6th red monthly candle since the beginning of the current bear market.
For comparison, the 2022 bear market printed a total of 9 red monthly candles before BTC eventually found its bottom.
If this pattern repeats, it would suggest that the market could still have 3 bearish months ahead of it.
Of course, history never repeats perfectly, but it often rhymes.
From that perspective, there is still room for further downside and a sweep of the remaining lows remains firmly in play.
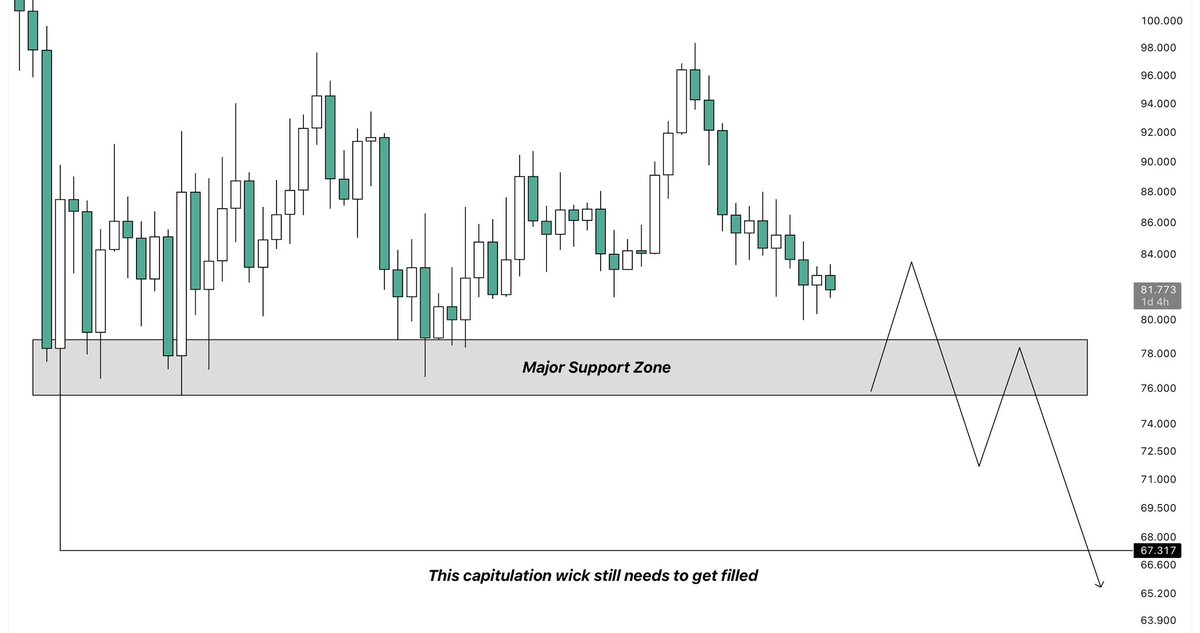
$SOL
Solana is currently trading right above its by far most important support zone.
This area has acted as support multiple times throughout the past few months and has been defended by buyers on every test so far.
As long as SOL remains above this level, there is still a case for consolidation and another attempt higher.
However, a confirmed breakdown would be a significant bearish development.
Below this support, there is very little structure left until the capitulation wick around $67, making it the most likely downside target if sellers regain control.
Losing this level would therefore likely result in a fill of the capitulation wick next.
@HODLingSailor That's sadly the truth. There's too many creators on here baiting people into a bullish narrative while the chart reads something completely different.
$BTC
I still don’t get why people were already calling for $100k while price was trading inside this major resistance zone.
In the end, we saw a deviation above the 0.5 Fib level followed by a strong rejection that put price right back at the highs of the previous range.
From a market structure perspective, this is exactly what you would expect to see at a level like this.
The rejection confirmed that bullish momentum wasn’t strong enough to reclaim this key HTF resistance zone and flip market structure bullish again.
As long as BTC remains below this area, I believe that we will eventually see a move back into the previous range and ultimately take out these remaining unswept lows below.
$BTC
BTC looks ready for a short squeeze.
There are currently over $10B in short liquidations resting above price compared to only around $3B in long liquidations below.
That creates a significant imbalance of more than 3:1 in favor of short liquidations.
The largest cluster sits between $78k and $79k, aligning perfectly with the key breakdown level I’ve been talking about over the past few days.
From a liquidity perspective, a retest of that area would therefore make a lot of sense.
$BTC
I'm still expecting a relief bounce to retest some of the recent breakdown levels.
Price has started to stabilize after the recent selloff, while volatility on the weekend remained relatively low.
But that should change later today or at the latest tomorrow as liquidity returns to the market.
If we get the bounce I'm expecting, the first level to watch will be the monthly open. A rejection there would likely lead to a relatively quick bearish continuation, where a sweep of the recent low at $72.5k becomes increasingly likely.
If price, on the other hand, manages to reclaim the monthly open, we should see a move into the key breakdown zone between $78k and $79k.
This area is not only our main liquidity target, but also lines up with multiple bearish confluences such as the Fibonacci Golden Pocket and the 200EMA.
This remains my primary scenario and the area where I believe the formation of a lower high is most likely.
$BTC
From a liquidity perspective a bounce here would definitely make sense.
Liquidity is now mostly resting on the upside, where multiple larger clusters have formed.
One of them sits directly above current market price and would get taken out if BTC pumps just 1%, while the remaining two are positioned near a key resistance level between $77k and $78k.
Below price, on the other hand we only have one notable cluster left, that sits just beneath the recent low around $72k.
This creates a clear imbalance that favors a short term move higher before we see further continuation to the downside.
$BTC
June is about to open with a scam pump and here’s why.
Over the past 10 months, the vast majority of monthly opens have been followed by a push higher before weakness sets in later throughout the rest of the month.
The only exceptions were November and February, where the previous month already ended with a dump and downside momentum simply carried over into the new month.
This time around, the setup once again supports the possibility of a move higher.
The recent selloff has created large amounts of liquidity above price, making a squeeze into the monthly open increasingly likely.
A move back into the recent breakdown levels would not only clear out that liquidity, but also provide the chance for a proper retest before continuing lower.
That said, I still believe any strength at the start of June is likely to be temporary and eventually turn into a bearish retest rather than the beginning of a new uptrend.
$BTC
Price is currently trading right above this major trendline from the daily as well as a key HTF support level.
Losing both of these levels would be a significant bearish development and could accelerate downside momentum over the coming weeks.
That said, I still expect a short term bounce from this area, especially considering the amount of liquidity that has built up above price during the recent selloff.
A move back into the $77.6k-$79.5k region would make the most sense, as this is where the recent breakdown originated and where several bearish confluences come together.
This area lines up with the 200EMA and the Golden Pocket, making it an area where the formation of a lower high is likely before we continue lower and eventually break the current uptrend.