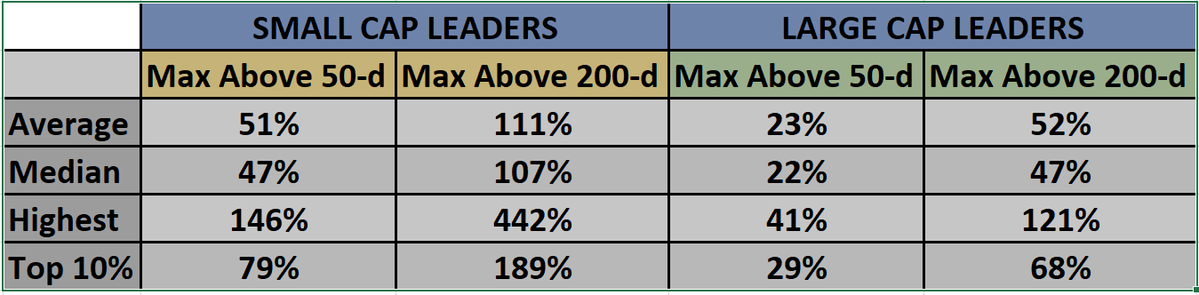
Have shares these stats @dennisc230 gave me years ago....maybe a little outdated without exact parameters but have always found the top 10% zone to be helpful....Bracco good info below
These are 10 timeless principles that I’ve picked up from @OliverKell_ over the years.
I’ve spent a lot of time studying these concepts, making mistakes & slowly integrating them into my personal system.
Here’s how I personally think about and apply each one in my own trading:
--
1. PUT RISK FIRST.
This completely changed my trading, because I used to be obsessed with making money. Now I’m obsessed with protecting mental/physical capital. Before entering any trade, I already know:
> where I’m wrong
> how much I can lose
> whether the reward justifies the risk
Most of my focus is honestly around avoiding disaster. One really bad trade can wipe out months of progress.
"Best losers win."
--
2. IF YOU FAIL TO PLAN, YOU ARE PLANNING TO FAIL.
Most of my work happens late at night + before the market even opens.
I’m building focus lists, marking pivots, studying leadership, identifying themes, setting alerts, reviewing earnings dates, and visualizing different scenarios beforehand. Once the bell rings, I don’t want to be “thinking,” I want to be reacting to preparation.
The traders who consistently look calm usually prepared the hardest.
--
3. DON’T TRUST YOUR STOCKS, TRUST YOUR STOPS.
The market does not care about my opinion or thesis.
This was one of the hardest lessons for me emotionally because I used to marry ideas. Now I understand that my stop is what protects me from myself. If price breaks my level and the trade loses character, I respect it and move on.
I can always re-enter later!
Don't be the big ego guy...take the hit and move on.
--
4. IT’S BETTER TO BE OUT AND WANT IN THAN IN AND WANT OUT.
There is nothing worse than being trapped emotionally in a position you know you oversized, chased, or forced. I’d much rather miss upside than sit frozen in a trade that’s completely violating my rules.
There will always be another setup.
Always.
FOMO is expensive.
--
5. LET YOUR PNL GUIDE YOUR LEVEL OF AGGRESSION.
This is something I think newer traders massively overlook.
When my system is working, leadership is acting well, and my equity curve is healthy, I naturally press harder. When conditions become choppy, or I’m in a drawdown, I intentionally reduce size and become defensive.
I trade in bursts.
You don’t need to force activity every single day. Some environments are designed to pay trend/momentum traders extremely well. Others are designed to chop you apart!
Learning the difference is a huge edge.
--
6. ONLY PRICE PAYS.
I love narratives and themes, but price always comes first.
A stock can have the greatest story in the world, but if institutions are not supporting the move through price action, volume, and relative strength, it’s irrelevant to me.
That’s why I focus so heavily on:
* leadership
* compression
* breakouts
* EMA behavior
* relative strength
* reactions to pullbacks
The chart tells me whether institutions agree with the story.
--
7. SELL INTO STRENGTH OR YOU WILL SELL INTO WEAKNESS.
Especially with Options!
Selling into strength feels uncomfortable because greed convinces you the move will never end. But when names become extremely extended from key moving averages, euphoric, or crowded, I’ve learned to start paying myself gradually.
* large extensions from the 9EMA
* emotional momentum expansions
* vertical moves
* major target levels
If you never sell strength, the market usually forces you to sell weakness later.
--
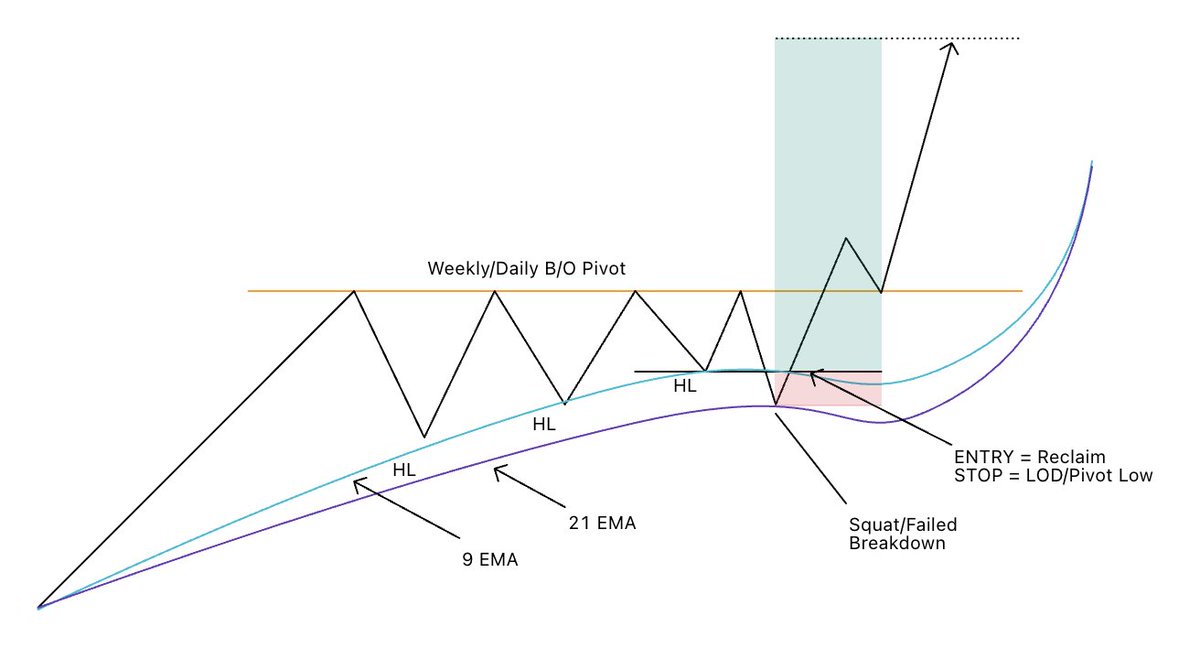
8. FROM FAILED MOVES COME FAST MOVES.
One of my favorite concepts :))
Failed breakdowns and failed moves often create violent reversals because positioning becomes trapped. Once price reclaims key levels, shorts cover, buyers step in aggressively, and momentum accelerates quickly.
That’s why I pay so much attention to:
- EMA crossbacks
- undercut & reclaim setups
- failed breakdowns
- reclaiming prior pivots
- failed gap-downs
The fastest moves in the market come from failed positioning.
--
9. DON’T GAMBLE ON EARNINGS.
I learned this lesson the hard way multiple times.
Earnings reactions are largely out of our control. You can have the right thesis and still get destroyed because guidance, margins, positioning, or expectations shifted.
Now I’m much more intentional around earnings:
> reducing size
> trimming beforehand
> avoiding oversized exposure
> planning scenarios ahead of time
The most recent example being $CRWV this last week, reduced position into ER and was stopped @ b/e.
Stop trying to hit a home run every quarter.
--
10. NEVER BUY EXTENDED STOCKS.
This principle alone probably would’ve saved me tens of thousands early on.
When stocks become massively extended from their moving averages, your risk/reward immediately worsens. Chasing usually comes from emotion, not process!!
I spend most of my time waiting for price to come into areas of interest. For ex: pullbacks into the 9/21EMAs, tight consolidations, inside days, compression areas, weekly support pivots, etc.
--
At the end of the day, all 10 of these principles really tie back into one bigger idea.
Survive long enough for my edge to compound.
Simple concepts, but very difficult to execute every single day.
Save/bookmark this post for later.
I hope this helps!
The 9/21EMA crossback continues to be one of my favorite areas for momentum returning to a leader.
You just needed to recognize the character change and catch a piece of the trend.
+50% on the underlying in 12 trading sessions, right off the 9/21EMA crossback.
Chart: $MU.
6 Entry Types Every Swing Trader Should Know
1. PDH Entry
Price moves above the Previous Day’s High. It shows strength continuing from the last session.
2. Strong Start Entry
A stock opens well and shows clear strength and high volumes in the first few minutes. After the initial push, a break of any range formation could be used as an entry . Useful in leading stocks.
3. Pivot Break Entry
Price breaks a level that has been rejected multiple times. This suggests sellers at that level are finally out of the way. A clean breakout candle usually confirms it.
4. Anticipation Entry
Entering slightly before a breakout, usually inside a tight consolidation on a day where price has gone pretty tight, at EOD. The structure should already be strong so the breakout has a higher chance of happening. Gives better risk–reward.
I wrote this article 18 years ago
https://t.co/6HPo2VKHmk
Chase the gap or wait for VWAP?
It is one of the best entry techniques there is! $SPY $QQQ today, low risk entry even in an extended market
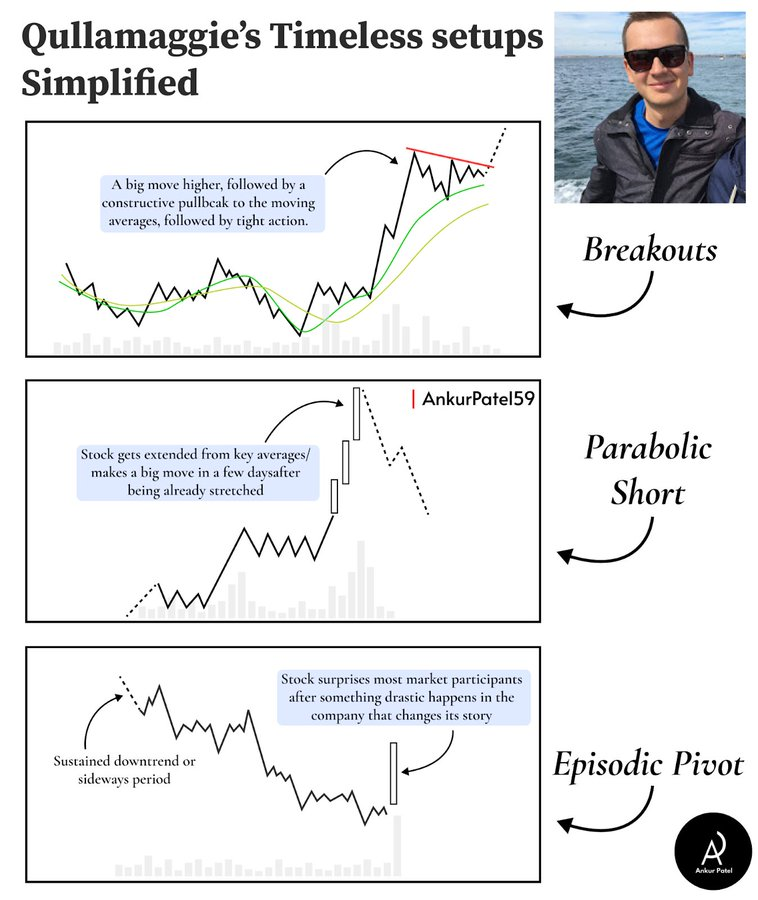
Qullamaggie's 3 Timeless Setups Simplified
Kristjan Qullamaggie has made tens of millions trading 3 simple setups. These setups occurred last year, 10 years ago, 50 years ago, and 100+ years ago. They occur over and over again.
1. Breakouts
Big move higher in the past 1-3 months. Orderly pullback with higher lows. Range expansion out of that consolidation.
How to trade it:
Enter on opening range highs when the stock breaks out
Stop at lows of the day (not wider than ATR/ADR)
Sell 1/3 to 1/2 after 3-5 days, move stop to breakeven
Trail the rest with 10-day or 20-day moving average
In bullish markets, these can give you 10-20x+ your initial risk if you're good at setup selection.
2. Parabolic Short (or Long)
Stocks are like rubber bands. When they get stretched short-term, they snap back hard.
How to trade it:
Stock up 50-100%+ in days/weeks (larger cap) or 300-1000%+ (smaller cap)
Up 3-5+ days in a row
Short on opening range lows or wait for first crack and fail at VWAP
Target is 10-day and 20-day moving averages
5-10x risk/reward, but higher win rate than other setups
3. Episodic Pivot (EP)
When unexpected good news hits a neglected stock, it can trigger multi-month or multi-year moves. Usually earnings or guidance that surprises the market.
How to trade it:
Big move (or gap up) in price 10%+
Big volume (preferably average daily volume traded in first 15-30 minutes)
Big growth numbers with significant beat to analyst expectations
Best if the stock hasn't rallied in the past 3-6 months
Enter on opening range highs. Stop at lows of the day. Trail with 10-day or 20-day moving average.
All of these setups are about finding low-risk entries on fast-moving stocks. Tight, high-probability areas to enter. High risk/reward on trades. You can be profitable with just a 25-30% win rate if you have small losses and big winners. Qullamaggie built an Evernote database over 7-8 years tracking thousands of these setups. He went back decades on thousands of stocks to find recurring patterns.
#Trading
THE 3 POWER SETUPS I TRADE 👇
These three setups make ~80% of my profits.
Everything else is noise.
1) Breakouts
After a strong prior run, the stock tightens ideally for ~2–3 weeks. Sometimes only days! Low volatility. Dry volume. Then it breaks and continues the trend. Simple continuation, not prediction.
2) Big Base Breakouts
A major advance. Then months of consolidation. A real base, not chop. When it resolves, it often leads to the next leg. This is where institutions reload.
3) Late Gap Entries
A powerful gap on earnings or news. Then digestion for days or weeks. When the stock tightens and reclaims highs, momentum often resumes fast.
All three have the same DNA:
• Clear uptrend (stocks are often up 100%+ from the 52 week low)
• Strong catalyst (20%+ sales growth, 50%+ EPS, or a compelling growth story)
• Liquidity and volume ($10-20M per day)
• Institutional interest (big accumulation)
Risk is always controlled:
• 3–5% stops
• 0.25–0.6% risk per trade
• Same sell rules every time: EMA8, EMA21, climax exits, or stop
My hit rate is only 30–40%.
And that’s fine.
Big winners pay for everything.
Focus beats variety.
Repetition beats creativity.
These patterns repeat.
I’ve taught them to thousands of traders.
I think everybody can learn these patterns.
Since the start of the year, 90% of my entries have come from Undercut + Reclaim or (U&R) setups against key EMAs and weekly pivots, and this past week offered a few perfect examples of why this approach is so powerful.
Here’s why U&R setups are so effective in this environment:
Take $RKLB and $APLD, I caught over +100% on 20 Feb contracts in both names. The ideas came from defined risk entries at failed breakdowns, precisely at the points where buyers stepped in after testing support.
Failed Breakdown = Inflection Point.
When a stock undercuts a key level like the 9/21 EMA or a weekly pivot, it triggers weak hands to sell and shorts to feel "confident."
...but if buyers step in immediately, it creates a shift in control, turning a previous low into a "high probability" entry point.
1) Defined Risk (most important):
Your stop is clear, the low of the day (LOD).
If the setup fails, you’re out quickly, keeping losses small.
If it works, the upside is often asymmetric, as you’re positioned ahead of the next leg.
2) Psychology:
U&R setups take advantage of human behavior.
Sellers panic, shorts get trapped, and buyers who understand the structure accumulate at the low, forcing shorts to cover, fueling a leg higher.
The result is compressed volatility followed by expansion, giving a clean, high probability entry.
3) Alignment with Institutions:
By watching RS names and key pivots, you’re essentially tracking where the real money is accumulating.
When the stock reclaims the level, you’re entering in sync with supply/demand, not guessing at breakouts.
4) Simplicity + Repeatability:
Watch the low, wait for the reclaim, enter, risk at LOD.
That’s it.
No chasing, no overcomplicating.
It’s repeatable, definable, and scalable, exactly why it’s been my go to entry since the start of 2026.
Other examples from the past week:
$ASTS
$HUT
$IREN
$RKLB
$APLD
Every single one followed the same U&R logic:
undercut
reclaim
demand showing
tight stop
...and then let momentum do the work.
The market environment this year has been rewarding buyers who enter at these lows, while chasing breakouts has been brutal.
U&R setups give you defined risk, a clear structure, and the ability to stay ahead of momentum before it fully expresses itself.
If you want to trade with asymmetric opportunities in this market, learning to spot and execute U&R setups is a must!
When the market cracks hard in a day, most stocks don’t escape the damage.
Even good basing setups usually slip below their 50-day or 20-day moving average.
That’s normal.
During these volatile or shakeout phases, my focus is not on new breakouts.
I simply track which stocks fall below their moving averages and how they behave after that.
Some stocks go below the 50 or 20-day and stay weak.
Those are easy to ignore.
The ones that matter are different.
They spend some time below the moving average — a few days or weeks — and then reclaim it back. Often, these are also the first stocks to reclaim when the market is still shaky.
That reclaim tells you one simple thing:
Buying interest is back.
Once a stock reclaims and holds above the 20 or 50-day, structure starts to form again. Price tightens. Risk becomes clearer.
So during market shakeouts, my job is simple:
I don’t chase strength.
I track who falls, who stabilizes, and who reclaims first.
#Trading
🎊 New Years Giveaway: 3 Deepvue yearly subs up for grabs!
✨ Advanced screening: technicals, fundamentals
✨ Multi-timeframe layouts, 100+ indicators (RS & EPS Lines)
✨ Presets from top traders
RT & reply with 'Deepvue' to enter!
🎉 Winners on Jan 5
https://t.co/ks9dVaABDe
Livermore talked about it. Wyckoff mapped it out. Even Dow saw it happening over and over.
Markets, whether you want to believe it or not, are not random.
They follow a cycle. This cycle is not something new. Stocks have always followed it, since the beginning of the markets.
And those who understand and follow this cycle, and merge that understanding with the way they trade, tend to achieve far greater results than traders who execute their system in isolation.
Most traders don't pay attention to this. They find a setup that works and they apply it everywhere, all the time. They don't consider where the stock is in its journey. They don't ask: is this just starting? Is this extended? Is this exhausted?
They just see a setup and take the trade.
And that's why they struggle.
Because a breakout in the early stages of a move is very different from a breakout in the late stages. The risk is different. The reward is different. The probability is different.
The greats understood this. They didn't just trade patterns. They traded patterns in context. They knew where the stock was in its cycle and adjusted their approach accordingly.
I've written about this in depth in my book "Swing Trading Simplified." The cycle matters. It's not optional knowledge. It's fundamental to successful trading.
If you're executing your system without understanding market cycles, you're leaving money on the table. Or worse, you're taking unnecessary risks.
Learn the cycle. It changes everything.
After you’ve watched thousands of charts, you start to see the same sequence play out again and again:
- A big move up
- Tight consolidation
- A retest of the 9/21 day
- A shakeout
- Then expansion
Different stock, different theme, same human behavior underneath.
Most traders overcomplicate everything.
After years of overanalyzing and blowing mental capital, I found a simple process that keeps me consistent.
Here’s exactly how I trade weekly breakouts, manage on the daily, and execute intraday.
It’s simple, repeatable, and it works:
Weekly timeframe: (where the setup begins)
I’m watching for stocks basing around the 9 week and holding above the 21 week.
The ideal look? A multi week base forming tight right above the moving averages, that’s where institutions are accumulating.
I prefer setups pushing toward all time highs.
Preferably, names in price discovery, not stuck in prior supply zones.
That’s where breakouts tend to run the most.
Daily timeframe: (managing the trade)
The daily chart is where I manage risk, watch opens/closes, and plan my executions.
My favorite entries come when a stock undercuts/reclaims the 9/21/50 days.
Recently, the 50 day has been butter, giving entries off undercuts/reclaims.
But ideally, I’m watching the 9/21 day confluence for confirmation of strength.
Inside days are slept upon entry models. They create defined risk and clear triggers; you know exactly where you’re wrong.
If price breaks above the inside day, that’s my entry.
If it fails and breaks below, I’m out.
Simple. No overthinking. Just execution.
Intraday Execution: (5/15 min)
I execute my entries using the 5/15 minute chart.
Once I’ve identified my trigger on the daily, I drop down intraday to look for micro confirmation, volume pickup, tight consolidation, or a clean break of a pivot point.
I place my stop at the previous higher low or pivot on the daily.
If a stock moves off my trigger too fast, I don’t chase.
I wait for a retest of that pivot, VWAP, or a retest of the EMAs.
At the end of the day, this process helps me stay consistent:
- Weekly = identify structure & trend
- Daily = manage entries, exits, and closes
- Intraday = execution
The goal isn’t to catch every move.
The goal is to execute my process over and over, because consistency compounds.
Compression → Expansion.
That’s my basic framework.
A big part of my system revolves around high tight flags, big base breakouts, and Stage 2 transitions.
In simple terms: Compression → Expansion.
When volatility contracts, price tightens, EMAs align, and volume confirms, that’s where the next wave of momentum usually starts...
But what do I personally look for?
great question... :)
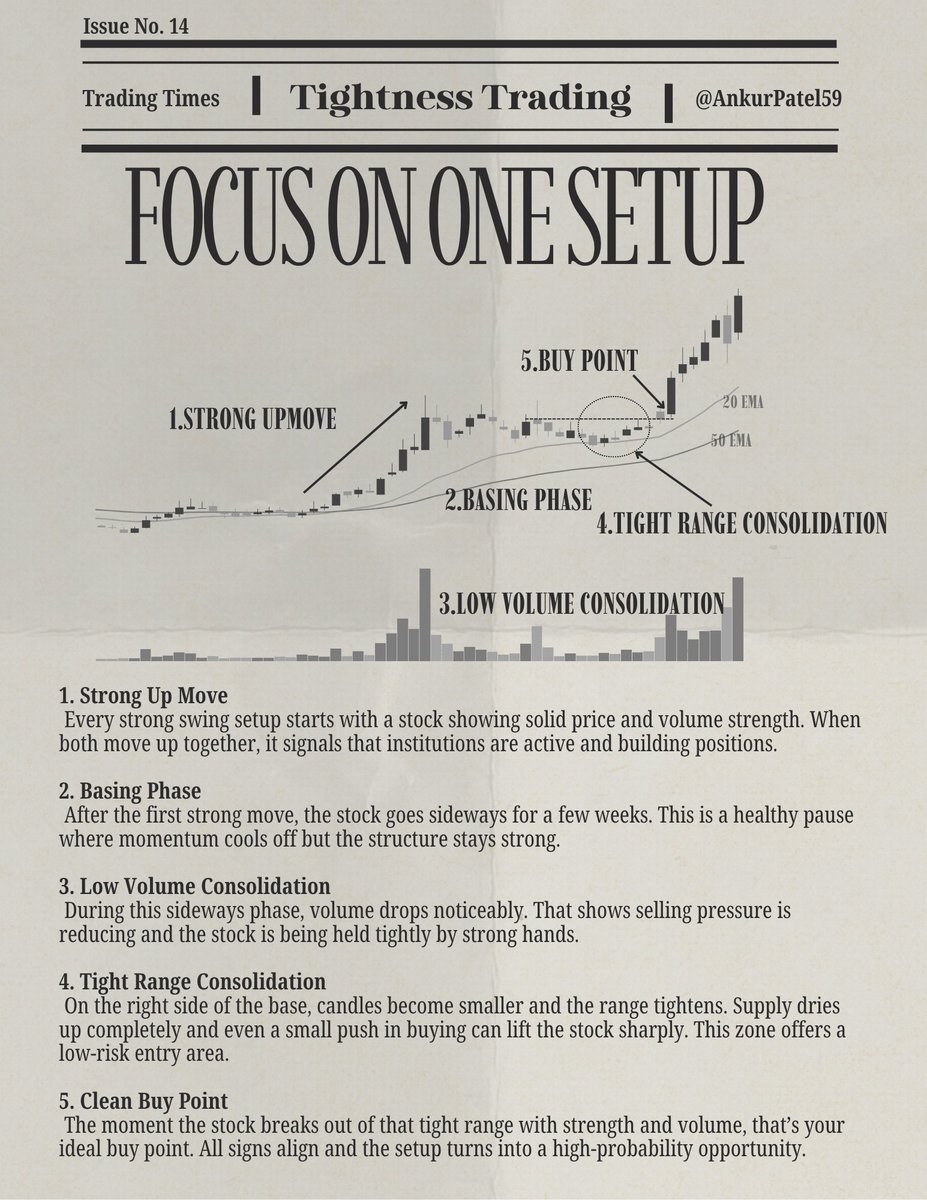
1) A Strong Move Up: Every great breakout starts with strength.
You need a clear leader showing strong volume and follow through off the lows.
I want to see a name that’s separating from its group or leading the sector; this shows institutional demand is present.
2) The Basing Phase: After the initial move, strong stocks rest.
I watch how they behave near the 9/21/50 EMAs because the best names build orderly, low volume bases around these moving averages.
Volume dries up, volatility contracts, price makes HH/HLs, and that’s your clue that institutions are accumulating > distributing.
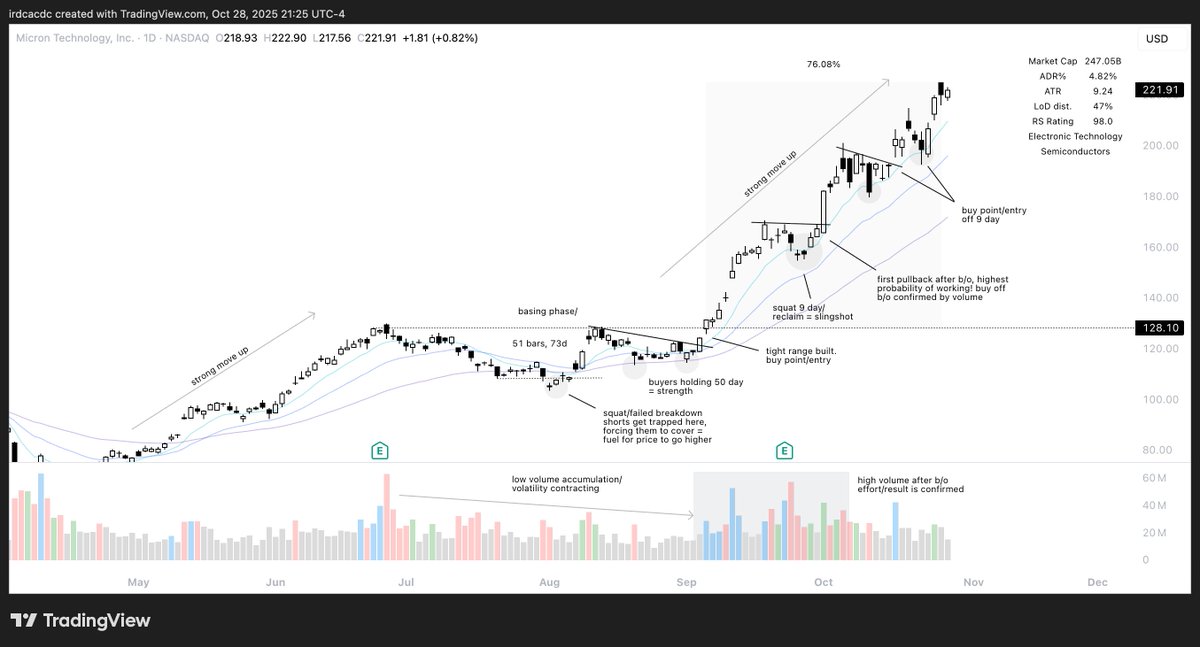
In $MU 's case, we got a textbook base:
- 70+ days of sideways action
- Volume contraction
- Price making HHs and HLs
- Price tightening on the right side
- Buyers quietly holding the 50 day
etc...
That’s where I start planning my entry/risk.
3) Bounces off the 21/50 EMA: This is one of my favorite tells for strength.
When a stock dips into the 21/50 day, shakes out weak hands, and immediately recovers, it shows active buyers defending the trend.
That’s usually where I’ll start building a position or planning an add/entry if the structure holds.
4) Tight Range Within Consolidation Phase: The tighter the range, the bigger the potential.
This is where I’m zoomed in, looking for volume signs and price compression along the 9/21-day EMAs.
When price tightens near resistance with higher lows forming, that’s pressure building for the breakout.
In $MU, that final tight range before the breakout was clean, small candles, low volume, EMAs stacked; all signs of control by institutions.
5) Breakout + Follow Through:
The breakout itself should be decisive, strong volume, clean move through resistance, and ideally a close near highs.
That’s your trigger.
After the breakout, I focus on:
- Whether price holds the 9 day (momentum intact)
- Whether volume expands on strength and dries up on pullbacks
Know that the first pullback post breakout often has the highest probability of continuing higher.
In $MU, that first pullback after the breakout was a great textbook “buy the retest” opportunity.
The 9/21/50 EMAs show me...
9 = momentum
21 = momentum/structure
50 = trend confirmation
When all three are rising and aligned, it tells me the trend is healthy, and I can press my winners.
The key is patience because the best breakouts don’t happen randomly. They form through environment, tight structure, time, and are confirmed with volume.
$MU is a great reminder that when you align technical structure with timing and patience, you can catch high R/R setups in real time.
I always say it in all my posts...
Compression → Expansion.
The bigger the base, the higher in space.
It’s how you catch the leaders before the move happens.
Bookmark and study this chart!
Most traders would be so much better off if they just bought leaders off the weekly 9 EMA/50 day.
You don’t need to catch every breakout or time every bottom. You just need to understand where institutions reload.
Every cycle, it’s the same:
- Leaders run.
- They pull back to the EMAs.
- Weak hands sell.
- Strong hands add.
Then comes the next leg.
You’d be shocked at how simple it really is if you can train your eye and your patience.
Stop buying extended.
Stop chasing random momentum.
Wait for the leaders to test their moving averages and prove they’re ready for round 2.
This setup alone can be your entire playbook if you master it. You’ll stop forcing trades and wait for the trade to come to you.
That's edge.
It’s Halloween, but idc...
I want this more than you.
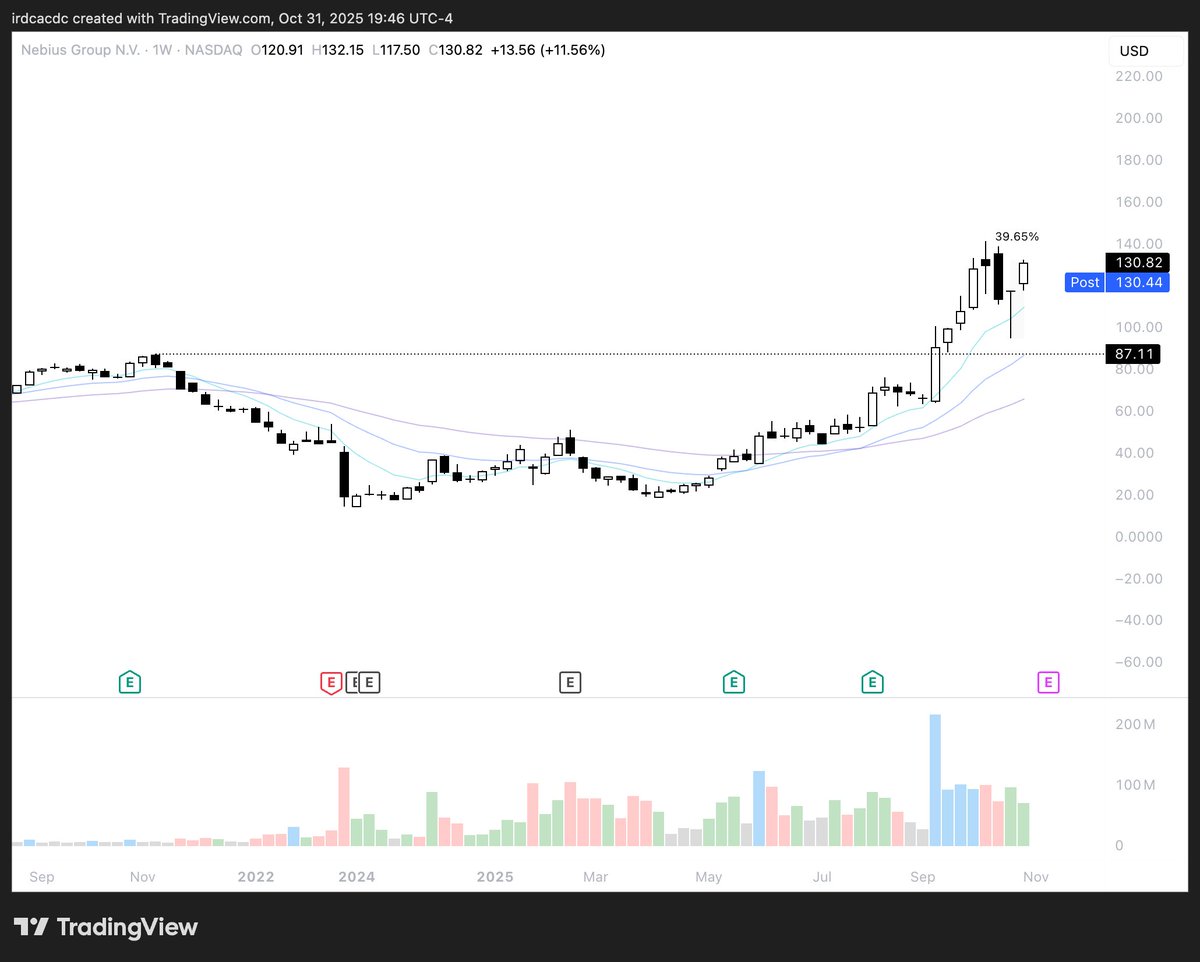
Back to the charts: $PLTR $CRDO $NBIS $QS