Some new graphics made for American Rivers show not only the drought we are facing, but other impending crises including hydroelectric generation and dead pool.
NEW: Infographics that reflect the latest data on Colorado River Basin reservoir levels. Spoiler: they're shockingly low. Graphics by @_nbqs, @water4colorado
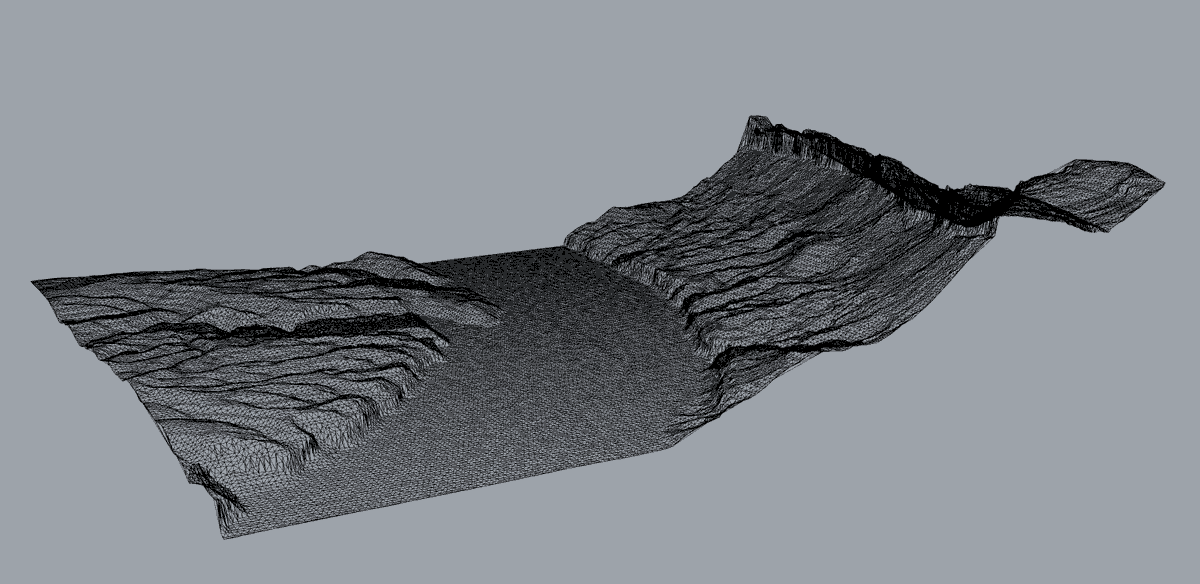
Export 3D .STL files straight from landscape point cloud datasets, great to have this feature up and running and to work on this with everyone @OpenTopography
Trend: OT users are interested in 3D modeling. Here's a #Jupyter notebook that demos how to subset/thin point cloud datasets using a voxel > triangulation > surface mesh workflow to export a .STL file that can be opened in 3D modeling software: https://t.co/6fmRRk47iP by @_nbqs
https://t.co/4KxeWYnSwj
Putting Green NYC is open for the summer M-F 3-8 and Sat/Sun 10-9 on the Williamsburg, BK waterfront. Come check out the hole I designed and built with @BillionOyster and Chris Edmonds telling the historical and future story of oysters in New York Harbor.
@CALWATERIMPACT Yes, been working on it. Will be a different graphic as that’s related to water levels instead of volume capacity but stay tuned on it. Thanks for the question and the work you all do!
@awhager Thanks for sharing my graphic! Comments below were corrected on my profile, please take a look at that one! Look forward to sharing more water issue graphics coming soon
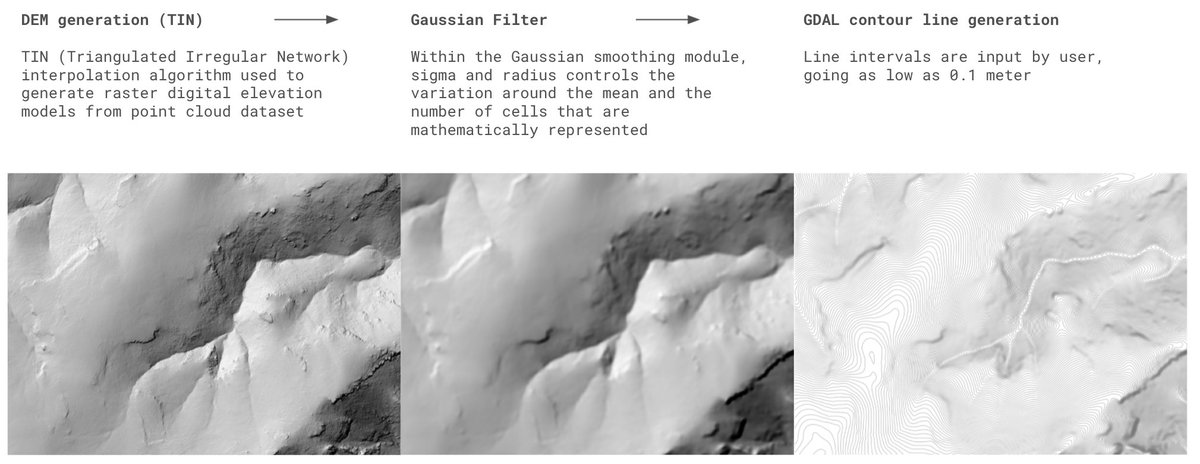
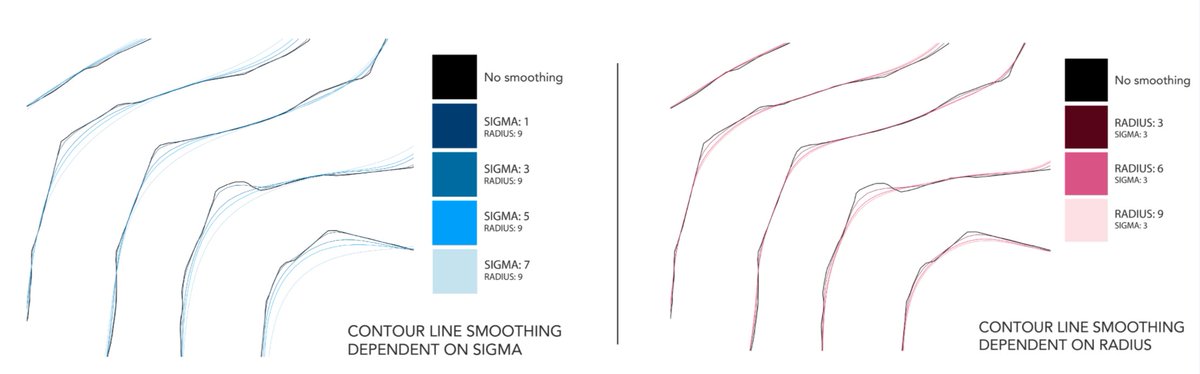
A long-standing OpenTopography feature request has been contour line generation. Today we're happy to launch an on-demand tool that generates contours from point clouds & rasters w/ user-controlled DEM smoothing to make cleaner contours. Learn more: https://t.co/wwQkRYlv18 #lidar
When the planet we love is under attack – STAND UP, FIGHT BACK. Will you join the fight as thousands take to New York streets on Sept 20 for the #ClimateStrike? #StrikeWithUs https://t.co/WyPR5pxPxq
Just published "The Meandering Mississippi River" story on Medium. Part of an ongoing examination of our relationship with natural systems; this one focusing on geopolitical boundaries based on changing river geomorphology. Check it out and thanks! https://t.co/mrKd2enTT8
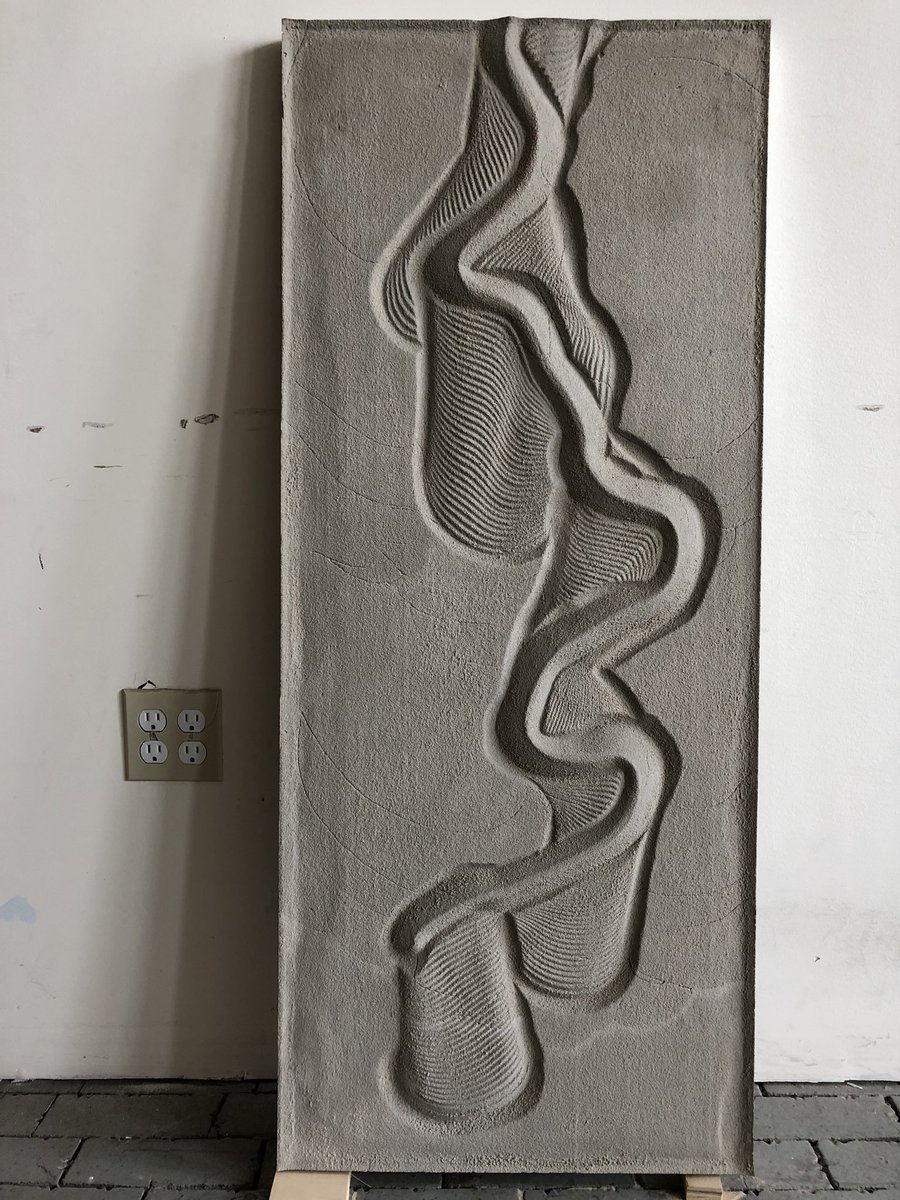
Concrete casting made from historical vector files of the Mississippi River. Thick line is current location, smaller waves are past locations (1820-2019). Process explanation to follow.
During @HouseJudiciary today, I shared why the #EqualityAct is so personal to me and my family. My child is finally free to be who they are. With that freedom comes a responsibility, for us as legislators, to legislate with love and not fear.