The honest frame: this is daily bars, tested mechanically, frictionless. ICT's intraday discretionary craft remains untested — and untestable from published rules.
Full tables, horizon curves, and the RSI irony:
https://t.co/la4jgkfMXt
I backtested ICT / Smart Money Concepts. Mechanically. 648 backtests across 4 markets.
Order blocks, fair value gaps, liquidity sweeps, Optimal Trade Entry — versus 3 boring entries, a coin flip, and buy-and-hold.
What survived: 🧵
Cross-market survival — the formal test. Does any family's best variant beat BOTH baselines on ALL four markets?
Survivors: none.
Order Block's 0.241 return per unit of drawdown on SPY fell to 0.104 on QQQ. Rankings reshuffle every market. That's what noise looks like, not a mechanism.
17,424 backtests, and here is what they cannot tell you.
Every figure in my Crabel rebuild is frictionless. No commission, no slippage, no spread.
The winning settings average a fraction of a per cent per trade. That is where your costs decide it.
https://t.co/uBIXo0zXAC
Every 4% dip triggers the same question: is this the big one?
History's answer, from all 127 completed S&P 500 declines of 3%+ since 1928:
• 73 reached −5%
• 26 reached −10%
• 12 became bears (−20%+)
Most dips die young. But once one hits −10%, it's nearly a coin flip (46%) it keeps going.
Full study: https://t.co/ZAqAWN5ysg
The best filter I tested made LESS money.
An OBV check on a MACD cross, 3,072 pairs:
Drawdown smaller: 85.7%
Profit factor better: 67.3%
Net profit better, long: 30.4%
Fewer trades. Fewer winners.
Judge a filter on profit and you bin the good ones.
https://t.co/PltuwdJS52
Decoded Dalio's chart, including the two columns nobody reproduces.
15 uncorrelated streams take your chance of a losing year from 40.1% to 16.6%.
The 1% at the bottom of his axis? That needs 100 streams.
Volatility falls with the square root of the count.
https://t.co/eJjuDmB759
Stock/bond correlation by decade:
1970s +0.25
1980s +0.31
1990s +0.27
2000s -0.33
2010s -0.45
2020s -0.08
The hedge that makes 60/40 work only showed up after 2000.
2022 wasn't an anomaly. It looked like the old normal.
https://t.co/oE2xQII3NZ
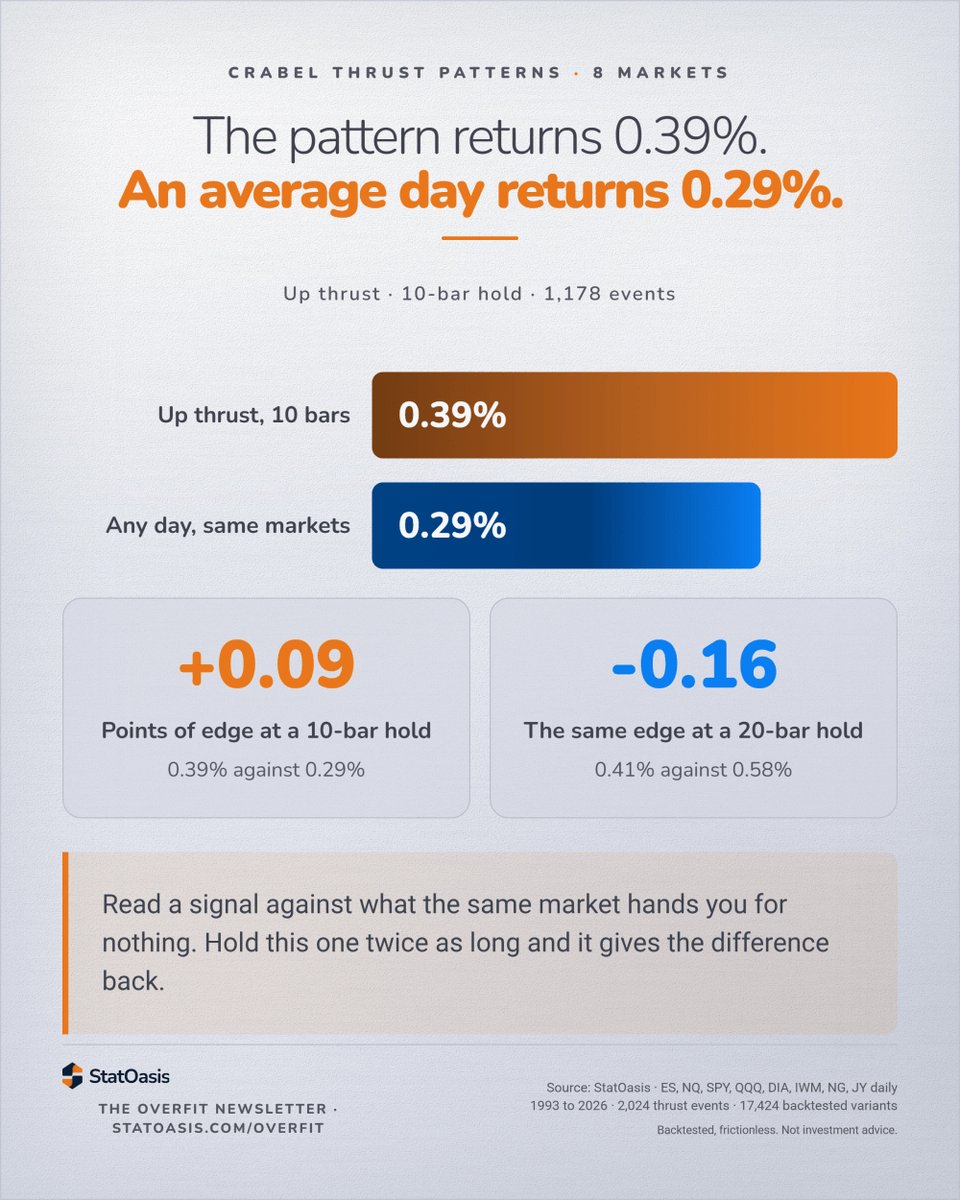
17,424 backtests on Toby Crabel's thrust patterns, eight markets.
Up thrust, 10-bar hold: +0.39%.
An average day in the same markets: +0.29%.
The pattern's own edge is 0.09 percentage points. Hold it 20 bars and you are behind, at -0.16.
https://t.co/uBIXo0zXAC
The OBV MACD is not a better MACD.
3,072 matched pairs. Same market, same periods, same side, same exit. Only the input changes.
Volume won 44.4% of them on profit factor.
Worse than a coin flip. Keep your MACD and let OBV veto it instead:
https://t.co/PltuwdJS52
The biggest finding is the one I didn't expect.
Stock/bond correlation by decade:
1970s +0.25
1980s +0.31
1990s +0.27
2000s -0.33
2010s -0.45
The 60/40 hedge is ~25 years old, not a law. 2022 looks like the old normal.
Full study:
https://t.co/oE2xQII3NZ
Ray Dalio's diversification argument: 15 good, uncorrelated return streams cut your risk ~80% without cutting your return.
The maths is real. I rebuilt it from the formula.
Then I checked the part nobody checks — whether the streams exist.
And the crisis story is backwards.
Across the 4 asset classes, correlation went NEGATIVE in five of six major declines since 1983 — including 2008 (-0.031) and COVID (-0.019).
Only 2022 went positive (+0.119).