Today is the DAY.
April 17, 2026.
The intermediate top before the most difficult time of the presidential cycle.
THE BAD NEWS
We're entering the mid-term correction phase.
Historically, markets correct an average of 16% during this period.
It's the weakest part of the 4-year presidential cycle.
And it starts NOW.
THE CHART
SPX Seasonal Composite 4-Year Presidential Cycle (99 years of data):
Election Year → Post-Election Year → Mid-Election Year → Pre-Election Year
Red line (current cycle): Peaked April 17, 2026
Black line (historical average): Shows consistent mid-term weakness
The pattern is clear.
Mid-election years are brutal.
THE HISTORICAL PATTERN
Out of the last 20 presidential cycles, we've witnessed 19 sharp mid-term corrections.
Average decline: 16%
Timing: Mid-election year (Year 2 of the cycle)
This is where markets reset.
THE GOOD NEWS
After 19 out of 19 sharp mid-term corrections, we've seen a new bull market.
Duration: 2 years
Phase: Pre-election year + election year (Year 3 and Year 4)
This is the most bullish part of the cycle.
THE SETUP
We're at the top of Year 2.
The correction is coming.
But the 2-year bull market follows.
THE MESSAGE
Buy any dip in the coming months.
Not now. Not at the top.
But when the market corrects 10%, 15%, 20% — that's your entry.
Because history says: Mid-term corrections are buying opportunities for the pre-election rally.
THE PLAYBOOK
1. We're at the intermediate top (April 17, 2026)
2. Expect a 16% correction over the next 6-9 months
3. Layer in during weakness (-10%, -15%, -20%)
4. Hold through the pre-election year rally (Year 3)
5. Ride the election year momentum (Year 4)
THE PATTERN NEVER FAILS
19 out of 19 times, the mid-term correction was followed by a 2-year bull market.
That's 100%.
THE LESSON
Don't panic during the correction.
Don't fight the cycle.
Buy the dip. Hold for 2 years.
That's the presidential cycle playbook.
Today is the DAY.
The top is in.
The correction starts now.
The opportunity is coming.
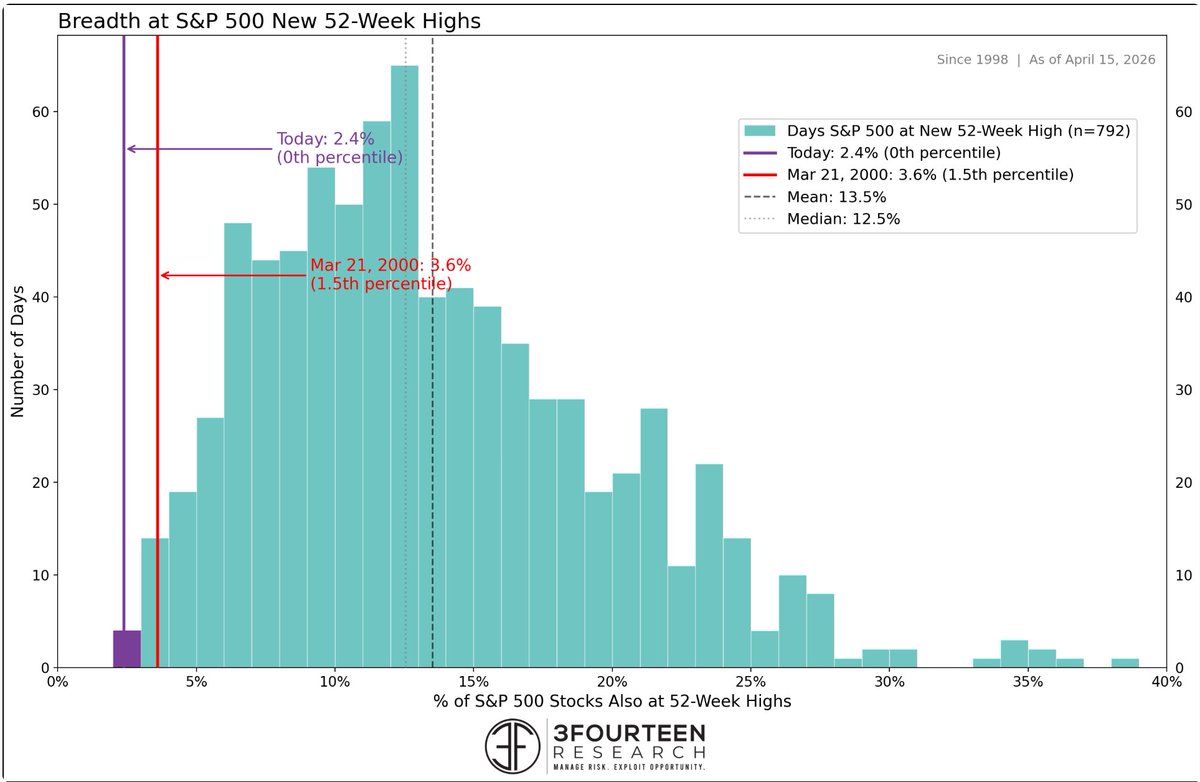
Yesterday's all-time high occurred with only 2.4% of S&P 500 stocks making a 52-week high.
Out of 792 days where the index made a new 52-week high since 1998, this is the fewest number of stocks participating.
The last 10-days have been unlike any 10-day period in the market since 1950.
First, the S&P 500 is up 9.8% in 10-days, which is in the 99.7th percentile of all 10 day returns.
My latest quarterly market update, with the technical perspective on the big picture in stocks, currencies, and commodities - including where we stand now and what may lay ahead.
https://t.co/ICdsAZ2ZHu
@NorgateData@STOCKSandCOMM Congratulations Richard. A well-deserved accolade for a world-beating product. @norgate is the gold standard for EOD data, as I always tell anyone who asks.
Scrolling through my feed, there are two dominant ways I see traders actually using AI right now and neither of them is particularly flattering.
Dashboarding
There's something incredibly fulfilling about creating a system that's beautifully designed, tracking all the metrics anyone could ever want, P&L overlays, heat maps, sentiment feeds, whatever. It feels like real work. But for many people, it's just procrastination in a more expensive suit. The dashboard becomes the real project, and actual trading gets pushed to the side.
Backtesting/Overfitting
AI has made backtesting so accessible and so fast that people can torture historical data until it confesses to almost anything. And they do. I've literally watched people backtest a strategy, find that it underperforms on certain days of the week or certain hours, and simply remove those periods from the sample.
The irony is that AI was supposed to remove human error from the process, but in practice it's often just amplifying the same old biases with a lot more computational power and a lot more speed behind them. Garbage in, garbage out; except now the garbage is better formatted and executes faster.
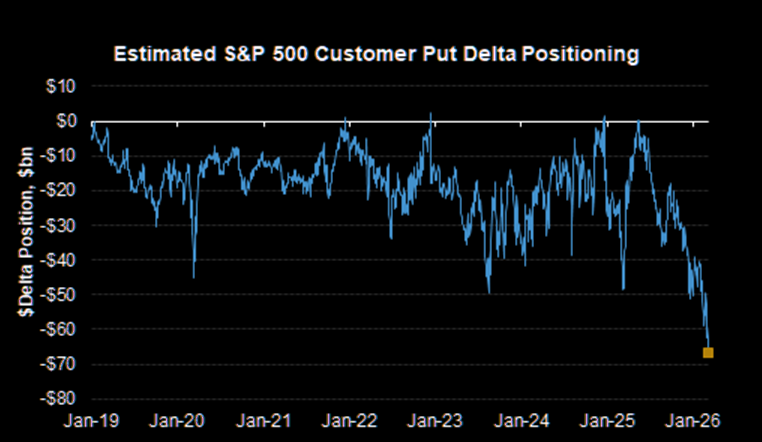
This chart, which has been doing the rounds, shows one of the most hedged equity markets in years. That usually means fear is already priced in, and the risk asymmetry increasingly favors upside surprises rather than further panic selling.
This chart tracks Estimated S&P 500 Customer Put Delta Positioning from 2019–2026.
Extreme hedging has often appeared near market turning points.
Right now the chart shows ~-$70B, the most negative level in the entire series.
A lot of bad news is already hedged. There is potential for a “hedge unwind rally”
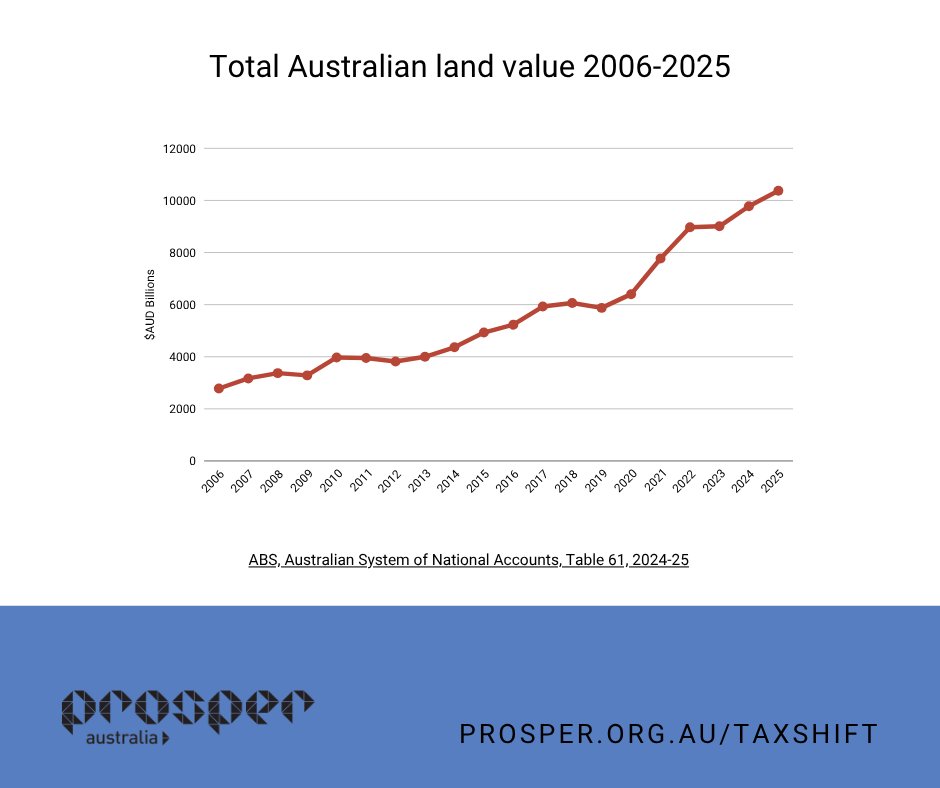
Australia’s land wealth now exceeds $10 trillion, yet most Aussies are still paying the bulk of taxes on their labour.
Other resource-rich nations reinvest unearned gains for the public, we let them flow largely untaxed to private owners.
📊: ABS ASNA, Table 61 2024-25
1/3
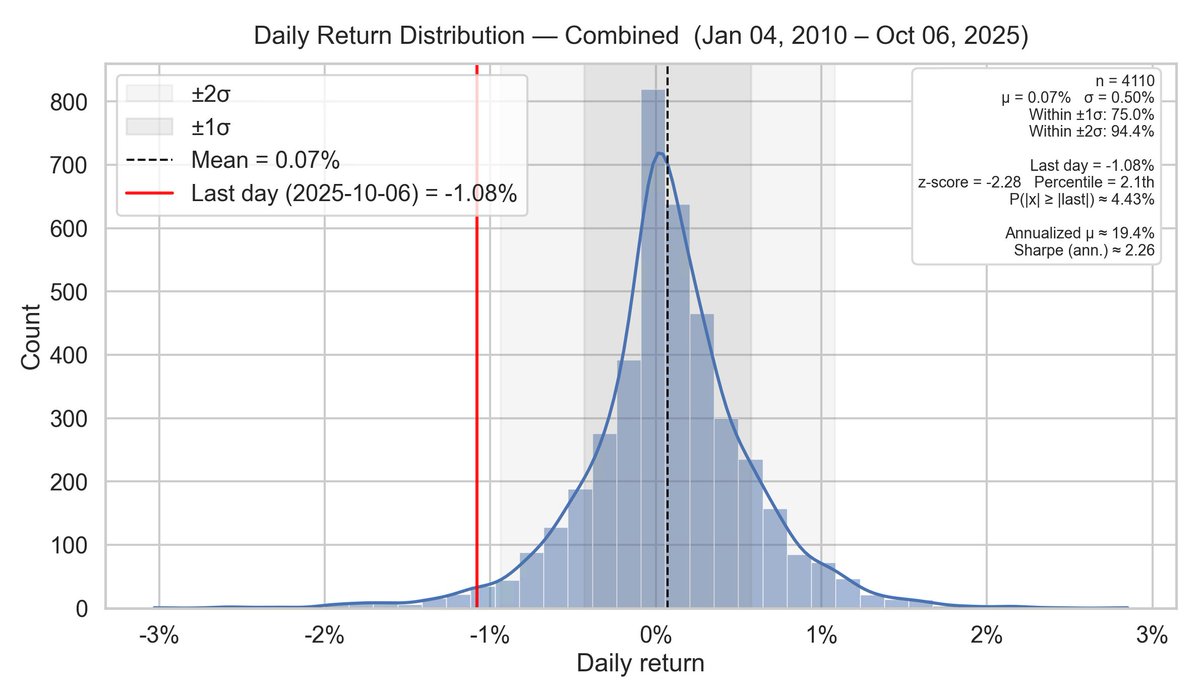
Traders panic over a bad day because they don’t know what’s normal.
One of the best ways to emotionally survive losses is to put them into context. 📊
I track every daily % PnL across the portfolio and plot them as a long-term distribution (live & backtest).
It shows what’s normal — even if returns aren’t perfectly normal-distributed.
Monday’s –1.08% loss?
z-score = –2.28 → roughly a 2.1% percentile event.
So I expect about 5–6 such days per year.
What this means to me:
• My risk sizing is right — I can absorb these
• If these events start clustering → something in my edge may be changing
Statistics ≠ perfection. But they turn fear into data — and data into control.
#SystematicTrading #RiskManagement #TradingPsychology
My latest quarterly market update, giving the technical perspective on the big picture in stocks, currencies, and commodities - including where we stand now and what may lay ahead.
https://t.co/kehqXjDBu6
The Wall Street Journal noted that the yield spread between the 2-year Treasury note and 30-year Treasury bond has steepened to the widest point in several years.
The last two times this yield curve cycled from inversion to a spread of +1.25%, it coincided with the two most wicked bear markets in generations.
Since the inception of the curve, those were the only two signals that preceded negative returns.
🔗Read @jasongoepfert's Sep 2 article "A curve ball from the yield curve" - full report available: https://t.co/kXP2nb3iVN
Excited to welcome @MicMcCarthy to this year's ATAA Conference in Melbourne, with @moomoo as a valued sponsor. Early bird registration ends Friday, August 22. Don't miss out! Book now: https://t.co/ME6wmbbzFT https://t.co/EUrIF6aXxn
Join the ATAA 2025 Conference: 'The Future of Trading – Blending Classic Tactics with Smart Technology'! Oct 18-19 in Melbourne (or online). Hear from experts like @lb_ASC, @RichB118, @Phil_J_Anderson & more on AI tools, strategies & networking. Non-members get 12 months FREE membership! Places limited – REGISTER NOW! #Trading #Investing #ATAA2025 https://t.co/wlTmdXi2KE
My latest quarterly market update, giving the technical perspective on the big picture in stocks, currencies, and commodities - including where we stand now and what may lay ahead. https://t.co/hJ1PVszSKS