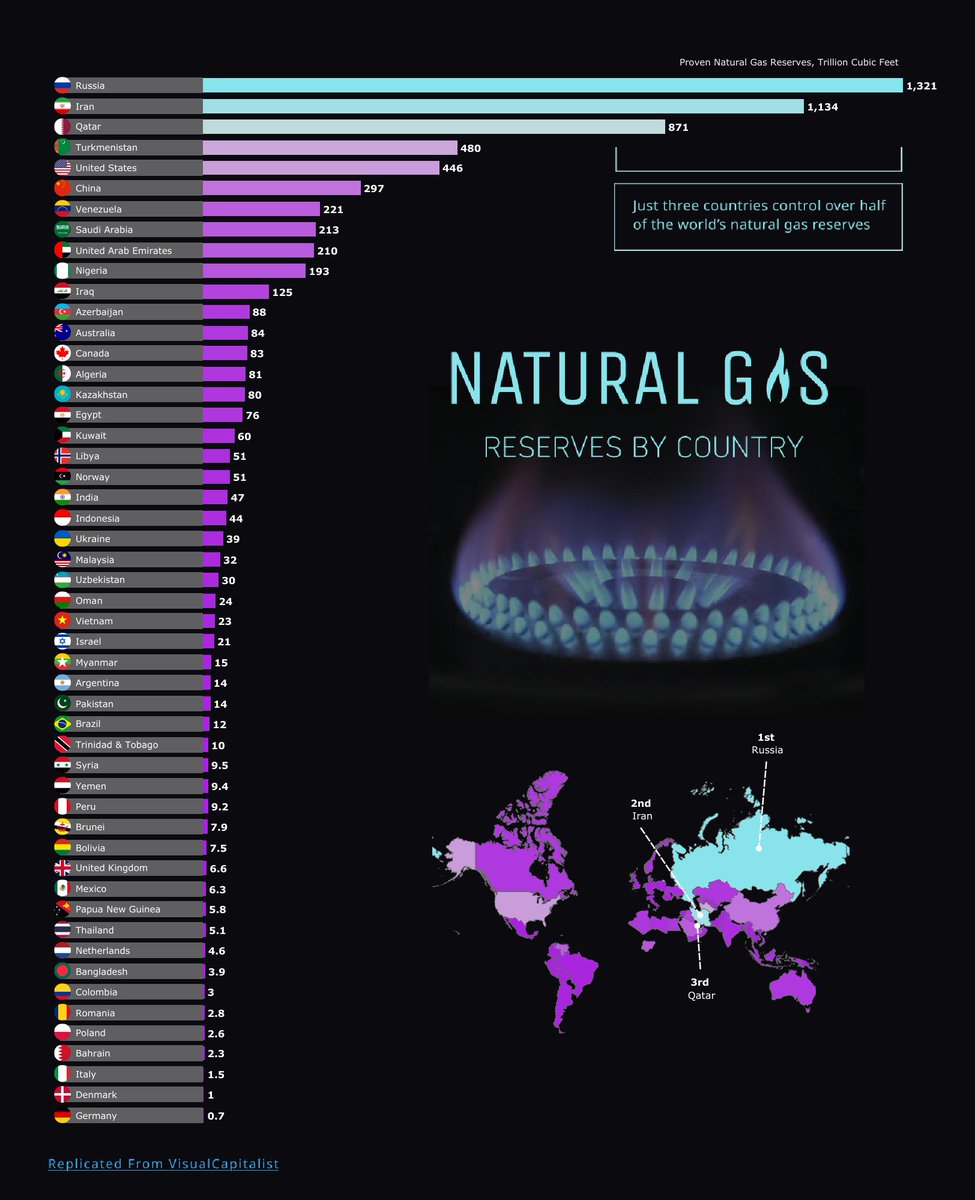
Recreated the Natural Gas Reserves by Country viz in #Tableau, inspired by Visual Capitalist. Focused on ranking, visual hierarchy, and geographic context to tell the story behind global energy reserves.
👉Check it out here: https://t.co/JLwjEWxjK7
#DataFam#DataViz
Hi #DataFam 👋
Here’s my interactive BMI Calculator dashboard built in #Tableau with a mobile app-inspired UI.
The design inspiration was taken from #Dribbble and recreated using #Tableau + creative dashboard engineering techniques.
Check it out here: https://t.co/KrJBF236Qz
This #VizOfTheDay by Michael McCusker showcases advanced design techniques using Tableau Map Layers. It demonstrates how to build highly custom layered visuals including interactive tables and infographics that go far beyond traditional mapping.
Explore the viz on Tableau Public: https://t.co/2PGDUsBD5m