multipassionate, broadly-trained ecologist specializing in data visualization & visual storytelling; opinions are my own | Science Communicator at USGS
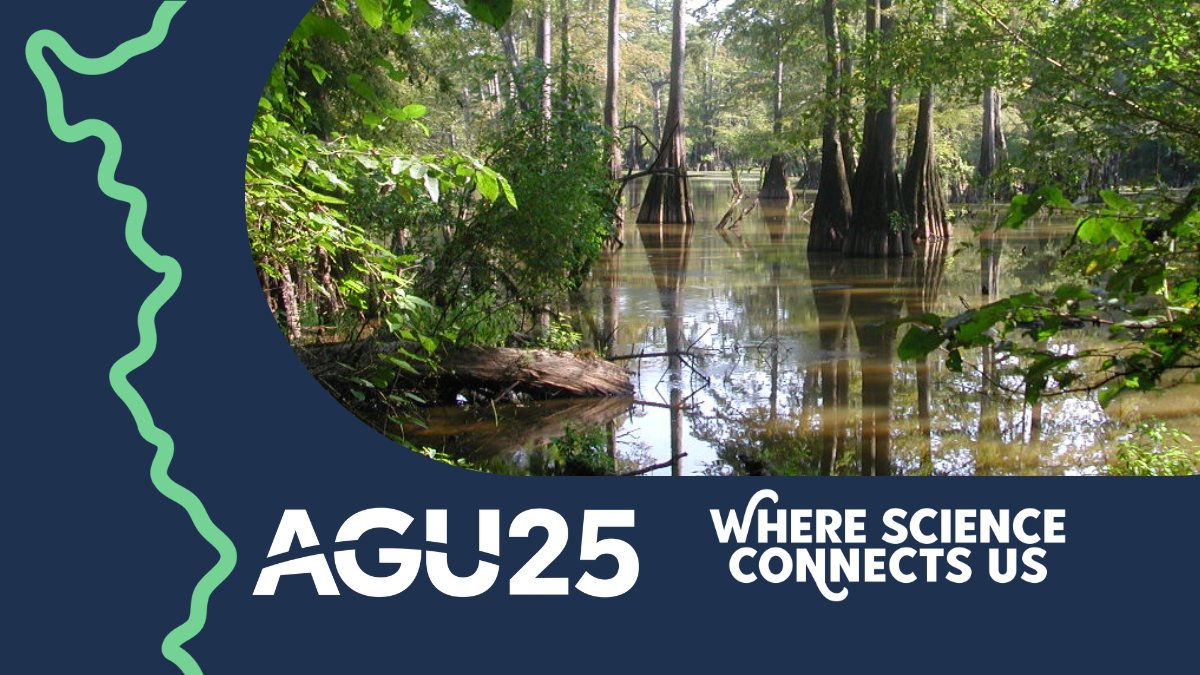
See you this week at AGU! We’ll be presenting on all things water, including drought forecasting, modern APIs, science education, data viz, and much, much more!
#AGU25#WaterData#USGS
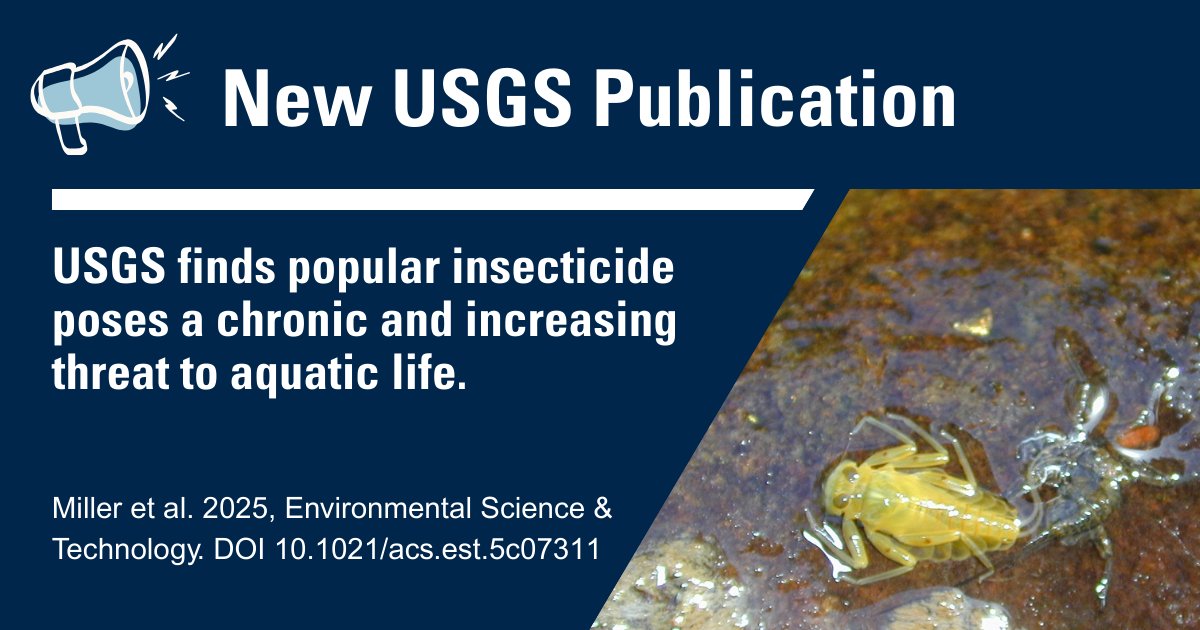
Pesticide exposure is linked to negative human-health effects. A new USGS study found that pesticides in groundwater rarely exceeded human-health benchmarks, 1993 to 2022.
https://t.co/TnqF4qeZAl
#WaterQuality#WaterUse#Pesticides
Mapping rivers just got easier! 🗺️💧
Our new blog displays how to create beautiful and reproducible river maps.
#nhdplusTools#dataRetrieval#ggplot#rstats
🔗: https://t.co/oiocmYsN1c
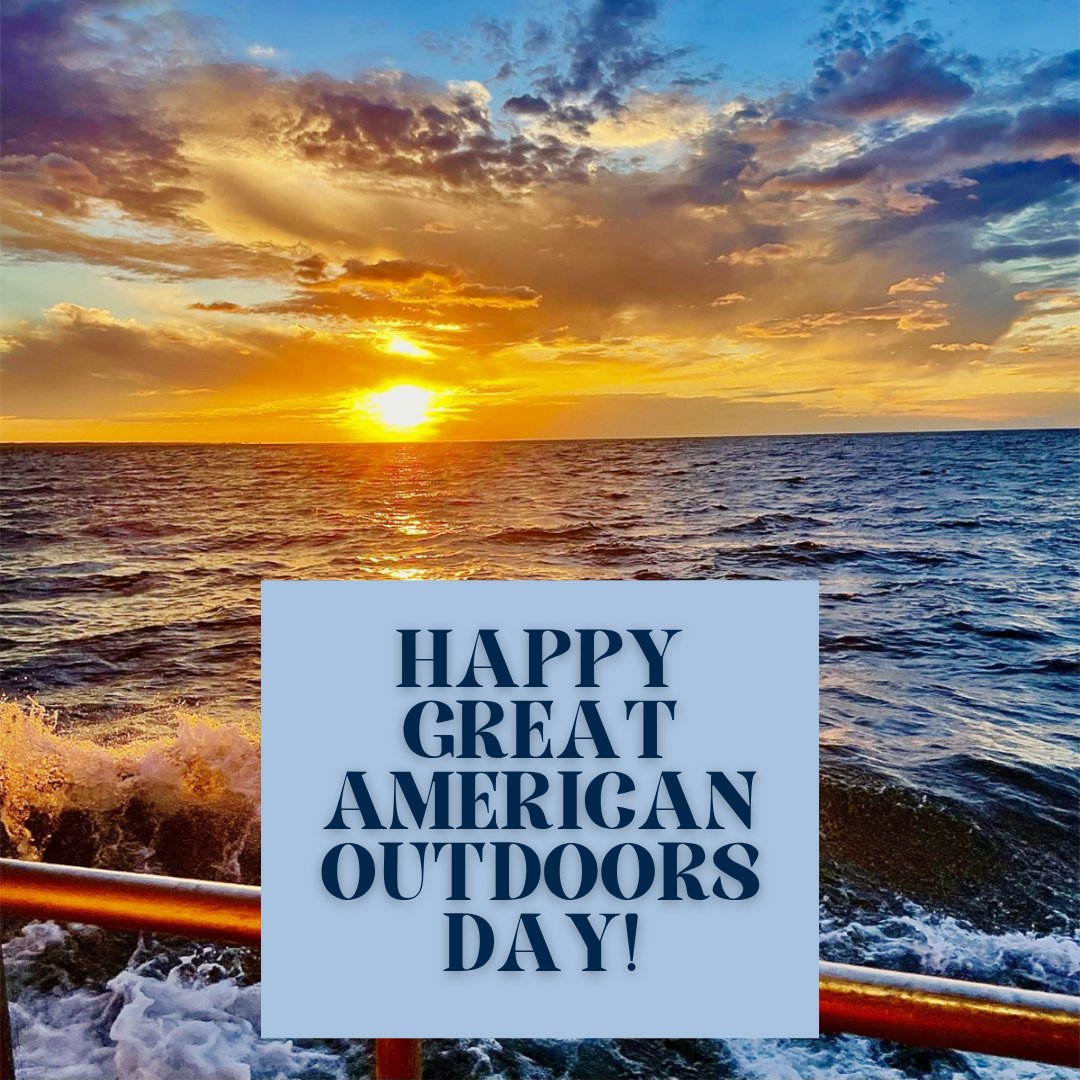
Happy Labor Day from USGS Water!
From our hydrologists in the field to the back-end developers delivering our data, we celebrate all of our #USGS Water employees!
#LaborDay
#Groundwater is one of our most valuable resources, and @USGS Water serves data on groundwater levels from nearly 1 million monitoring locations across the U.S.!
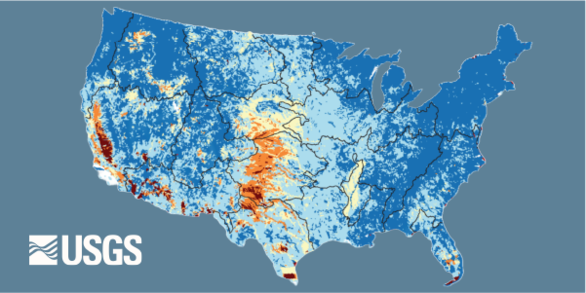
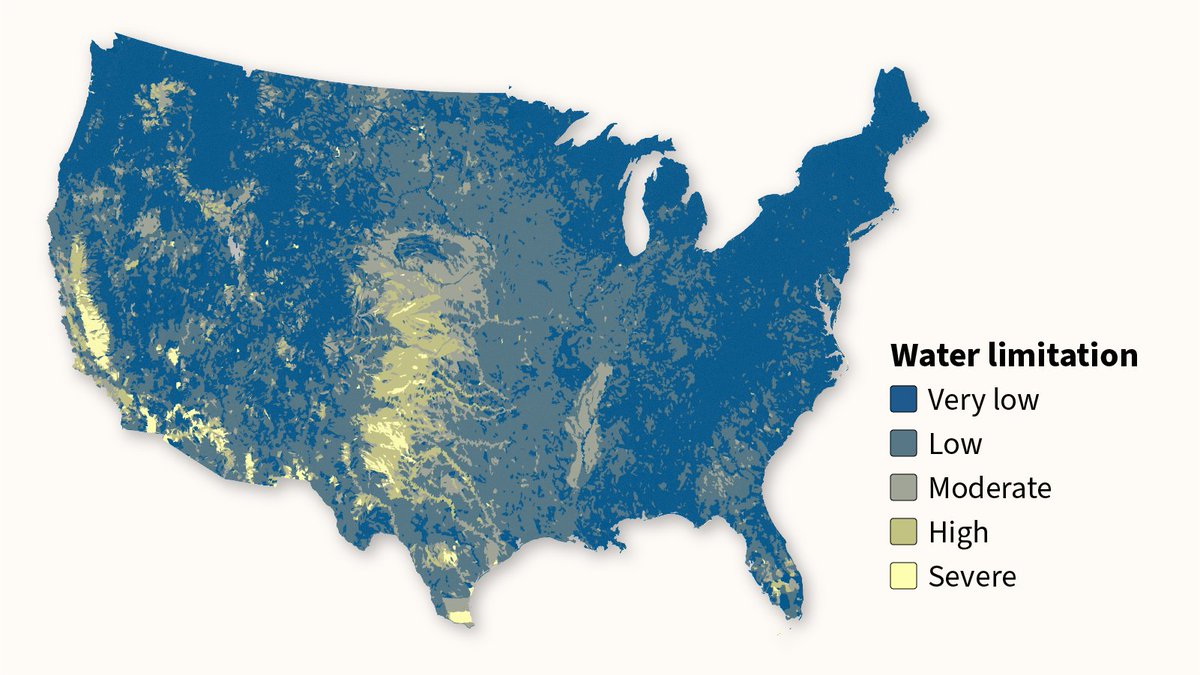
@USGS recently released the National Water Availability Assessment, providing an overview of water availability that offers first-of-its-kind insights into the balance between water supply & demand across the conterminous U.S. 💧
Check it out 👉 https://t.co/xD1iMXvhh4
Today, the USGS released the National Water Availability Assessment, which integrates info on water quality, quantity and use to provide a comprehensive view of water availability. Visit the Key Findings Interactive Website to learn more: https://t.co/YMrb4gYgeL
Do you use the dataRetrieval #rstats package? If so, consider joining us for usability testing. Your input will help shape the future of the package as we update functionality to serve USGS water data from new APIs. Interested? Email [email protected]
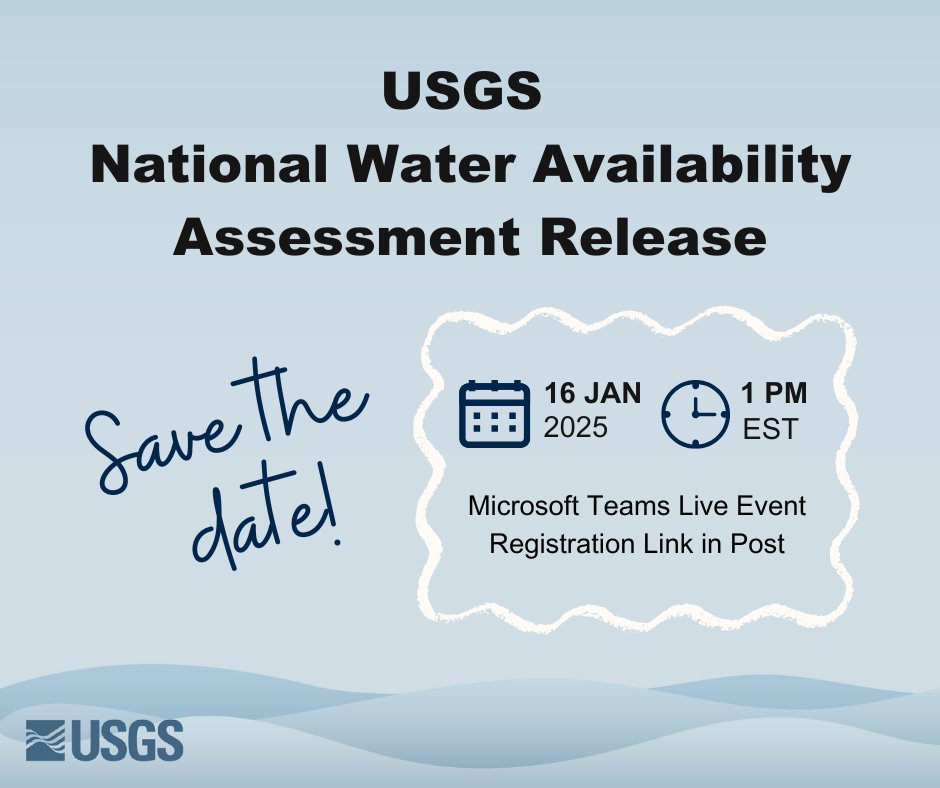
Join us on Thursday, Jan 16th for the release of the National Water Availability Assessment, a pioneering scientific overview of water availability across the conterminous US. Register for event here: https://t.co/D4z3sxPXh0
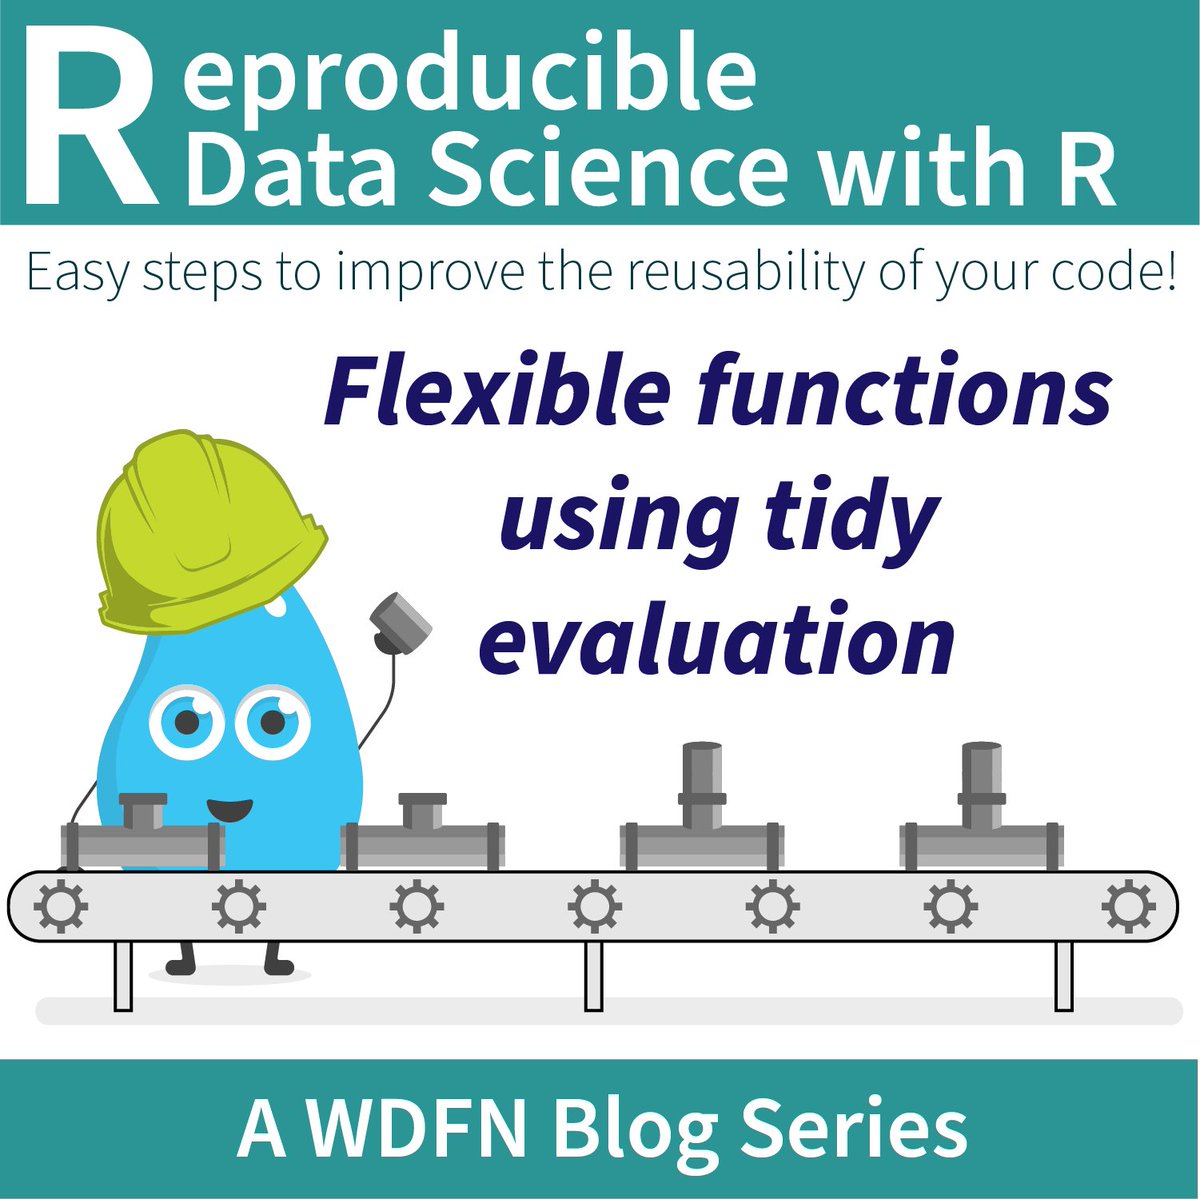
Learn to write more concise, efficient, and robust #rstats code in the next #WDFN#blog post.
We focus on the map_*() family of functions from the #tidyverse#purrr package to move away from copy/paste coding to save you time and grief.
https://t.co/k8CIIxsXLC
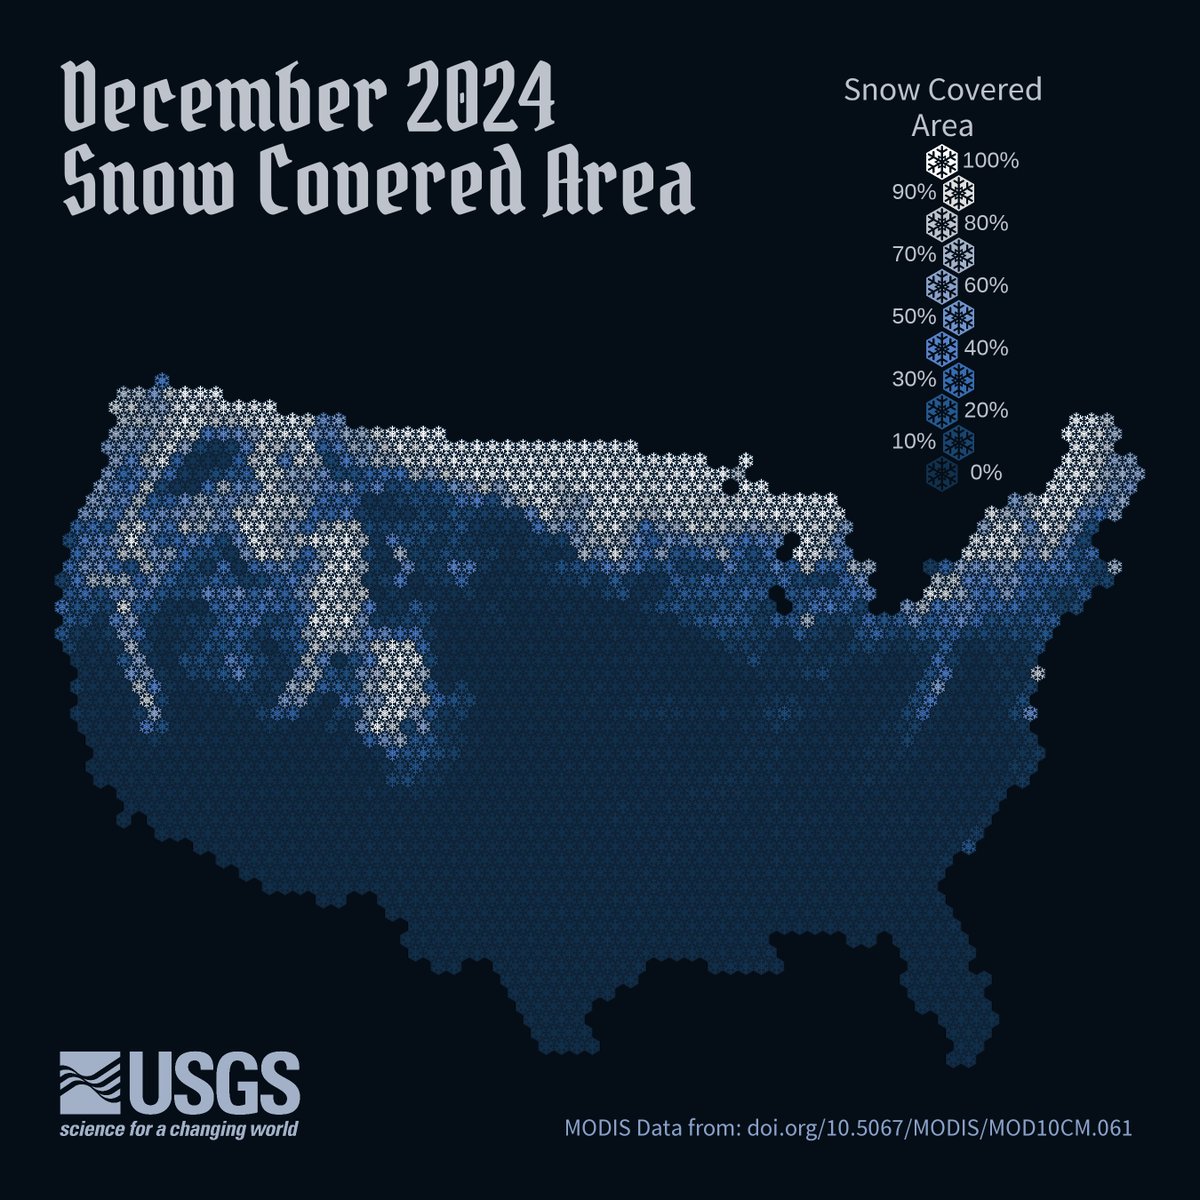
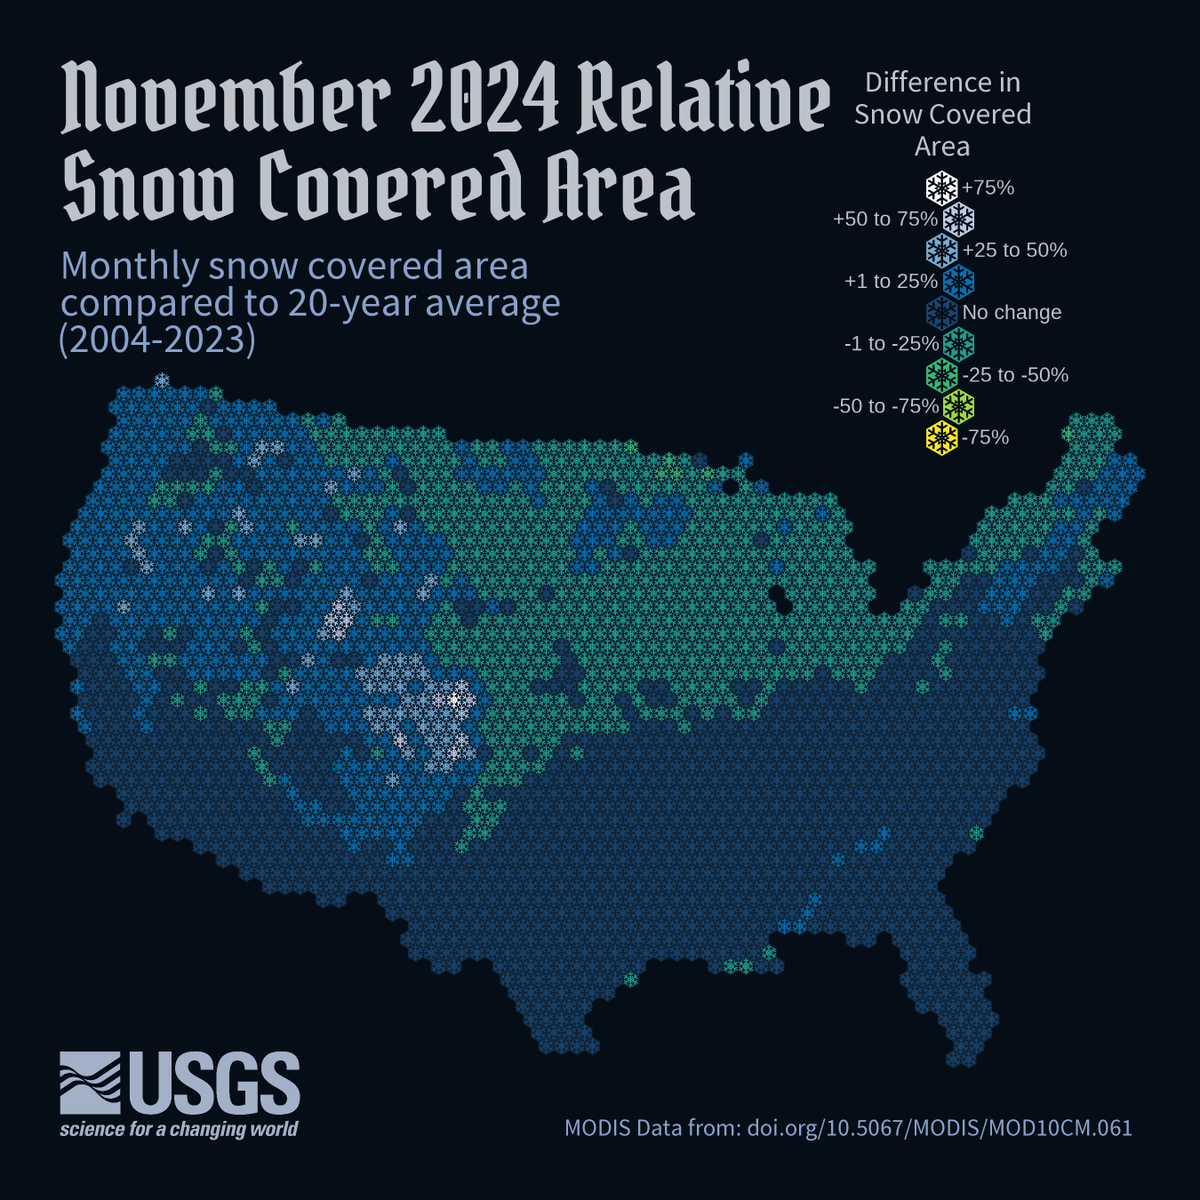
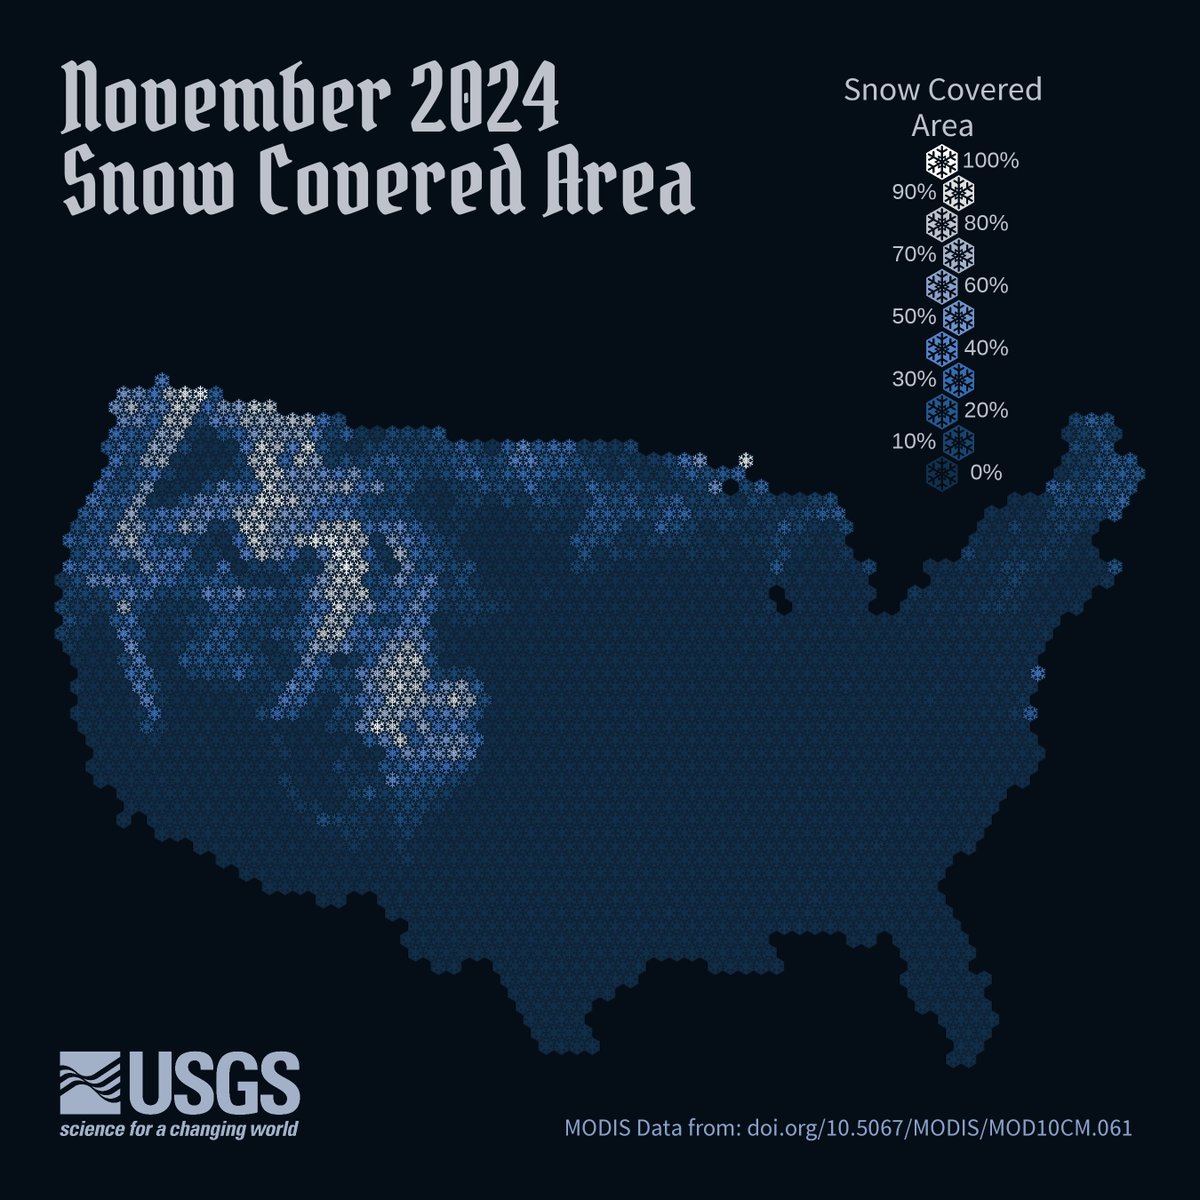
This November is off to a rocky (as in not-snowy) start to the winter! Most of the Great Plains and Midwest saw less snow cover than usual ❄️ #DataViz#rstats
Data from @NSIDC https://t.co/6dXuy2pX7A
The R.A.D. Framework leverages three equally important approaches for decision-making when managing changing systems: Resist, Accept, and Direct. #ClimateResiliency#WaterScienceWednesday
View the DataViz➡️https://t.co/u5VHFKCLEb
So excited to share our latest website! Unique data-storytelling style, fun #scicom approach, and with illustrations made by a former intern and myself.
Meet the Redband Trout of Oregon's Great Basin, a vital species in our river system and a key indicator of aquatic ecosystem health. These beautiful fish reflect the condition of the lakes and streams they inhabit. View the #DataViz: https://t.co/WZ8TxjEzpC