CARDIOVASCULAR RISK REDUCTION IN DIABETES
Lowering HbA1c is only one part of protecting the heart.
This 8-part visual masterclass covers:
1️⃣ Diabetes diagnosis & glycemic targets
2️⃣ Glucose-lowering medications
4️⃣ SGLT2 inhibitors & GLP-1 receptor agonists
5️⃣ Insulin & inpatient hyperglycemia
6️⃣ Cardiovascular risk assessment
7️⃣ Blood pressure, lipids & antiplatelet therapy
8️⃣ Lifestyle, kidney protection & complication screening
Based on the ADA Standards of Care in Diabetes-2026, with a focus on evidence-based clinical practice.
Control glucose. Protect the heart. Preserve kidney function.
Save for revision and share with a colleague.
#Cardiology #Diabetes #MedTwitter
#HYPERTENSION: From Diagnosis to Emergency Management
High blood pressure is more than a number.
It’s a risk factor for stroke, heart failure, kidney disease, and aortic dissection.
This visual guide covers:
⭕ Diagnosis & classification
⭕ Drug selection & resistant HTN
⭕ Hypertensive emergencies
Learn it. Apply it. Save it.
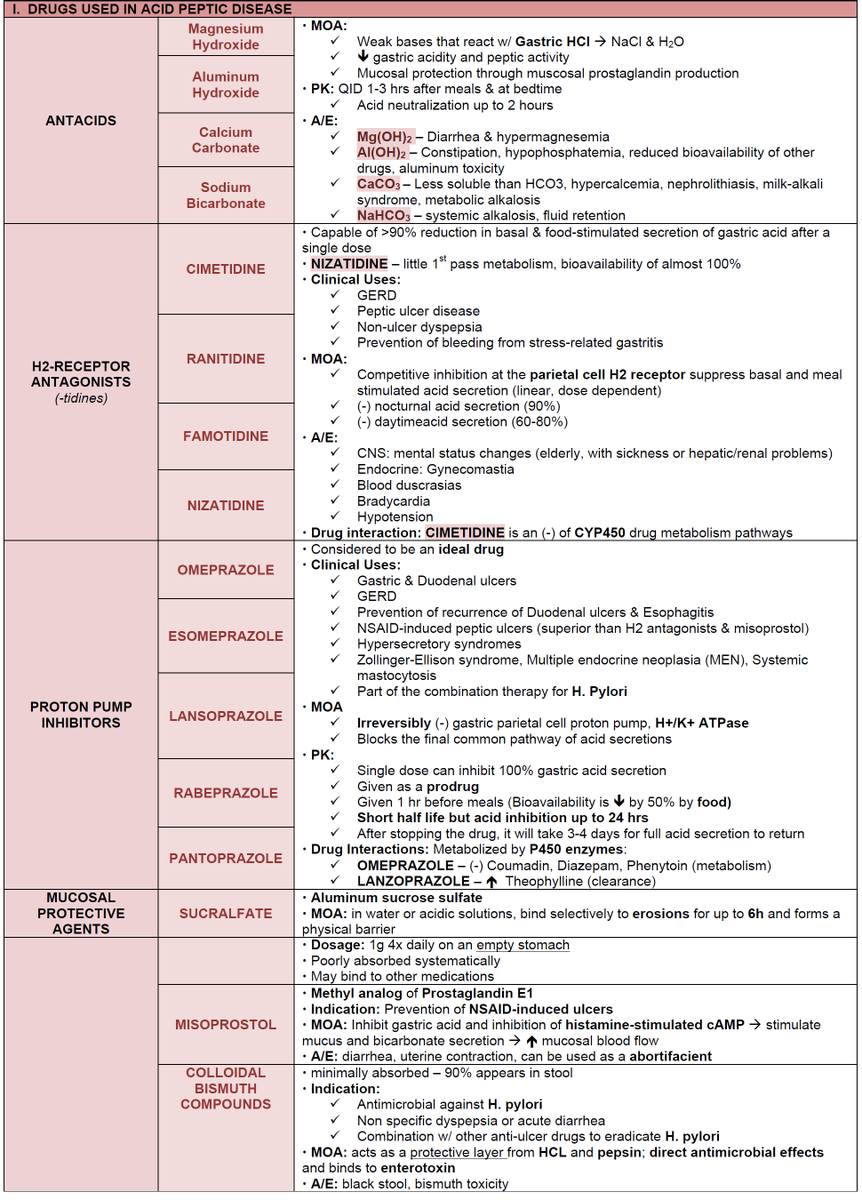
Autoimmune gastritis has traditionally been viewed mainly as a risk factor for gastric neuroendocrine tumours and non-cardia gastric adenocarcinoma. But could its cancer risk extend further?
Read the #RecentAdvancesInClinicalPractice#GUTRecentAdvancesInClinicalPractice by Lenti et al. entitled “Autoimmune gastritis: a hidden gateway to cardia and oesophageal cancers beyond non-cardia gastric adenocarcinoma” via https://t.co/Ve38KXIdju
This review brings together emerging epidemiological and clinical evidence suggesting that autoimmune gastritis and pernicious anaemia may also be associated with malignancies involving the gastric cardia, gastro-oesophageal junction and oesophagus.
The authors explore possible mechanisms including corpus-predominant atrophy, intestinal metaplasia and vitamin B12 deficiency, while highlighting important gaps in our current understanding.
The review challenges us to think beyond the traditional boundaries of autoimmune gastritis and raises important questions about future risk stratification and surveillance.
#AutoimmuneGastritis
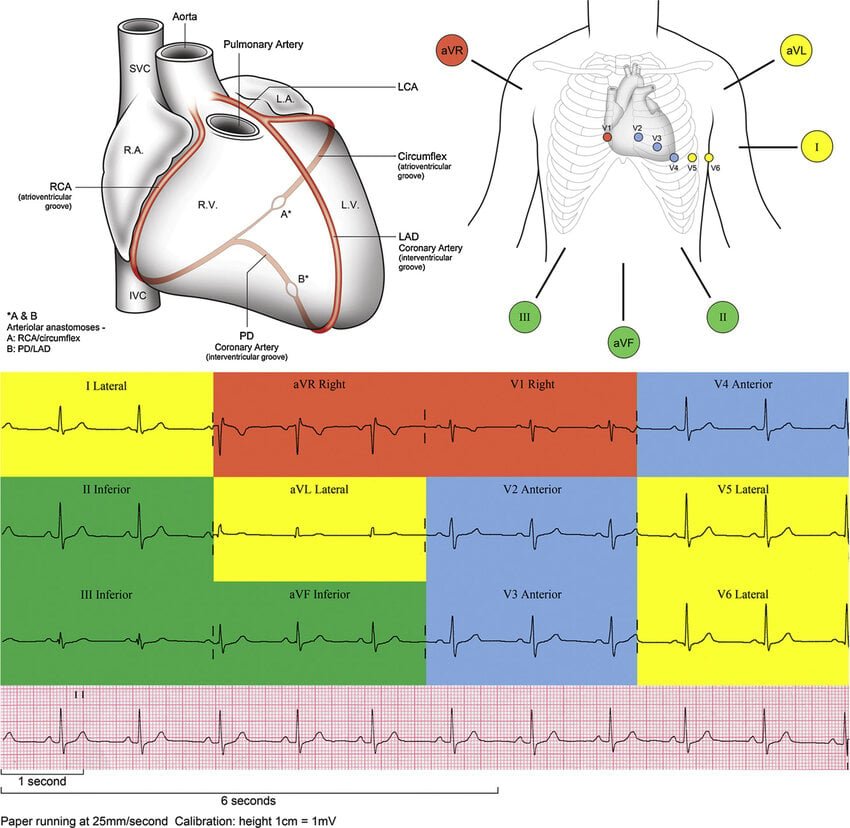
ECG From Scratch #48: Localizing MI on the 12-Lead ECG
When myocardial infarction occurs, the ECG can help identify the likely myocardial territory involved.
Think in territories rather than memorizing 12 individual leads:
🟢Inferior: II, III, aVF
🟡 Lateral: I, aVL, V5, V6
🔵Anterior: V3, V4
⚪Septal: V1, V2
🟣 Right ventricular: V3R–V4R, especially V4R, when RV infarction is suspected
⚫Posterior: V7–V9 when posterior involvement is suspected
A common shortcut is V1–V4 = anteroseptal, but modern interpretation is more nuanced. Coronary anatomy varies considerably, and ECG territories do not perfectly correspond to a single coronary artery or anatomical region.
For example, inferior ST elevation usually suggests RCA or LCx involvement depending on coronary dominance. Lateral changes may reflect LCx or diagonal/obtuse marginal branches, while anterior changes often implicate the LAD.
Reciprocal changes can strengthen localization.
For example, inferior STEMI may produce ST depression in I and aVL.
But remember:
ECG localization is approximate, not anatomical proof.
Echocardiography can identify regional wall-motion abnormalities, while cardiac MRI provides much more precise tissue and infarct characterization. Coronary angiography identifies the culprit vessel.
Also, the traditional labels anteroseptal, anterolateral, anteroapical and posterior MI should not be interpreted as exact anatomical diagnoses. They describe ECG patterns and are imperfect surrogates for the actual infarct territory.
The practical approach:
1️⃣ Identify contiguous leads with ST-T abnormalities.
2️⃣ Group them into a territory.
3️⃣ Look for reciprocal changes.
4️⃣ Consider additional leads when appropriate, especially V3R–V4R for suspected RV infarction and V7–V9 for suspected posterior involvement.
5️⃣ Integrate the ECG with symptoms, serial ECGs, troponin, imaging and coronary anatomy.
Takeaway:
The 12-lead ECG is not a literal map of the heart. It is a multi-angle electrical view that helps you estimate where ischemia or infarction may be occurring.
ECG From Scratch #46: Hyperacute T Waves
A STEMI does not always begin with obvious ST elevation.
Sometimes the earliest ECG clue is a hyperacute T wave (HATW), reflecting acute coronary occlusion before conventional STEMI criteria become obvious.
What should you look for?
Hyperacute T waves tend to be:
◻️Broad, bulky and disproportionately large relative to the QRS
◼️More symmetric than normal T waves
◻️Prominent in anatomically contiguous leads
◼️Often dynamic, changing rapidly with evolving ischemia
The key is not simply a tall T wave. Normal variants, early repolarization, hyperkalemia and other conditions can produce prominent T waves.
A major 2025 JACC: Advances study developed and validated an objective HATW score based on two features:
1️⃣ Magnitude: T-wave area relative to QRS amplitude
2️⃣ Symmetry: T-wave peak-to-end time relative to the time from T-wave onset to peak
The proposed ECG threshold was 2 contiguous leads with an average HATW score ≥0.70.
Among patients without diagnostic STEMI criteria, the score achieved:
98.4% specificity
20.7% sensitivity
47.4% PPV
LR+ 12.54
Importantly, among patients without STEMI criteria who had a positive HATW score, 84% had a culprit lesion causing acute MI in this study.
But there is an important limitation: HATW is not yet a replacement for clinical assessment, serial ECGs or troponin. The study excluded patients with QRS ≥110 ms, and the sensitivity was low. The score therefore should be viewed as a high-specificity warning sign, not a rule-out test.
Current ACS guidance emphasizes that a nondiagnostic initial ECG does not exclude ACS and that serial ECGs are important when suspicion persists.
The learner's takeaway:
Do not wait for dramatic ST elevation.
In a patient with ischemic symptoms, a new, bulky, symmetric T wave in contiguous leads, especially when disproportionate to the QRS, may be the earliest ECG fingerprint of an occluded coronary artery.
Recognizing the pattern early can matter because time to reperfusion matters.
Reference:
https://t.co/NCsG06969x
LBBB IS NOT ONE DISEASE
A wide QRS with an LBBB pattern does not always mean the same thing is happening inside the heart.
That matters when choosing cardiac resynchronization therapy (CRT).
1. Complete conduction block
The electrical impulse is blocked within the His-Purkinje system, particularly the proximal left-sided conduction system.
The LV is then activated abnormally through slower myocardial conduction, producing electrical and mechanical dyssynchrony.
2. Intact Purkinje activation
The Purkinje system may still activate the LV, but hypertrophy or myocardial fibrosis can slow ventricular conduction.
The ECG can look like LBBB even though the mechanism is different.
3. Mixed disease
Some patients have proximal conduction block plus distal myocardial conduction delay or fibrosis.
This creates a more complex substrate for CRT.
4. Where can we pace?
Right ventricular pacing activates the ventricle away from the native conduction system.
His bundle pacing attempts to recruit the His-Purkinje system.
Left bundle branch area pacing targets the left-sided conduction system and can restore more physiological LV activation.
Left ventricular pacing through the coronary sinus provides another route for resynchronization.
5. Why does the mechanism matter?
CRT works best when there is true electrical dyssynchrony that can be corrected.
This helps explain why patients with the same LBBB appearance on ECG can respond differently to CRT.
Current guidance supports CRT strongly in appropriate patients with LVEF ≤35%, LBBB, QRS ≥150 ms and NYHA II–IV symptoms despite GDMT. Conduction system pacing, including His bundle or left bundle branch area pacing, is increasingly used when conventional CRT is unsuccessful or as an alternative in selected patients.
Reference: https://t.co/fPKqzX9W0q
🚨 A patient visited OPD with this unusual presentation.
On examination, vitals and the rest of the neurological/systemic examination were normal, except for this intermittent abnormal neck posture.
The neck repeatedly goes into hyperextension with deviation to the left, but returns to normal between episodes.
⏱️ Symptoms have been occurring on and off for >24 hours.
No:
• Pain
• Breathlessness
• Swelling
• Previous medical illness
• Recent illness
• Medication use
• Alcohol/drug use
• Animal bite
• Significant industrial exposure
🧠 What is the most likely diagnosis?
A. Cervical dystonia
B. Acute dystonic reaction
C. Focal motor seizure
D. Tetanus
What would be your next step in this patient? 👇
💥🏥 Hepatología Crítica en la UCI
🫀Falla Hepática Aguda
🩸Soporte Hemodinámico
🫘Lesión Renal y TRR
🧠Encefalopatía Hepática
💚Trasplante y Criterios
🔰📚World Journal of Critical Care Medicine 2026
Artículo Completo👇🏻✅🆓
https://t.co/aR5SFK2xfj Influenza.pdf
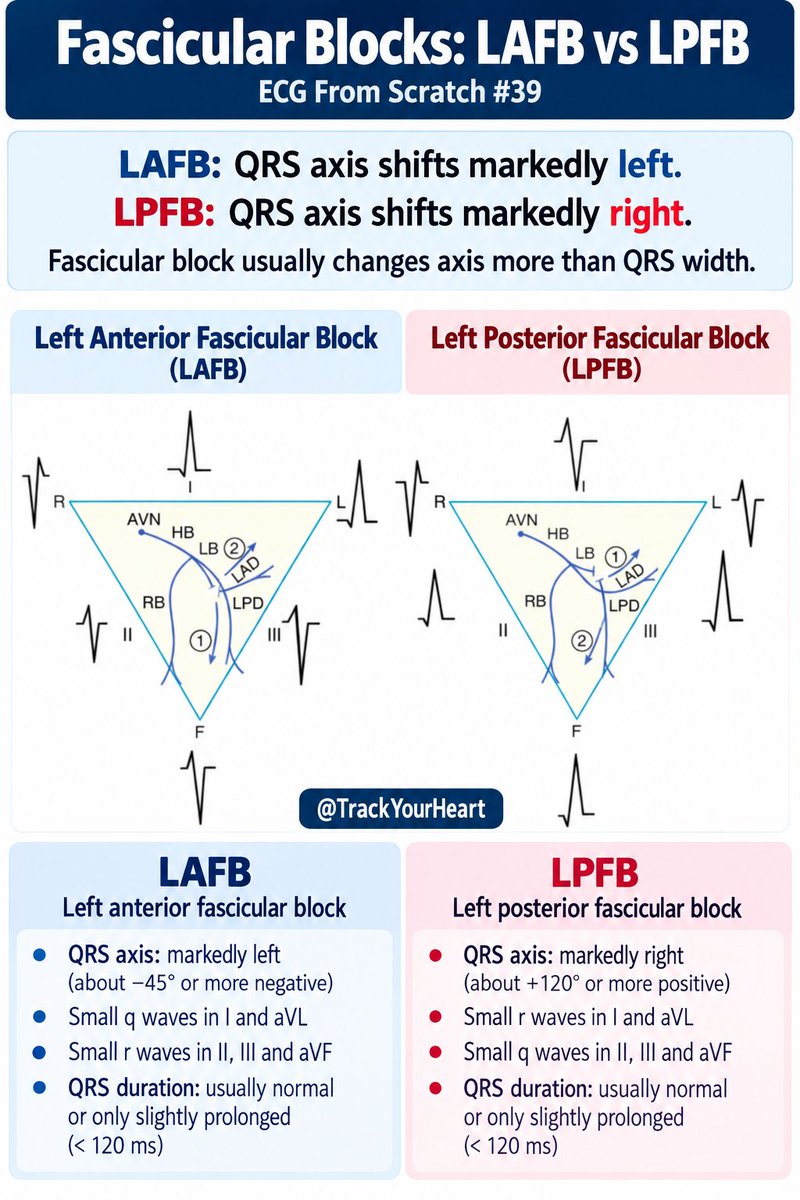
ECG From Scratch #39: Fascicular Blocks
Think of the left bundle as having two major pathways:
🔵Left anterior fascicle
⚪Left posterior fascicle
A block in either is called a fascicular block, or traditionally, a hemiblock.
Unlike complete RBBB or LBBB, a fascicular block usually changes the QRS axis much more than the QRS width.
1️⃣ Left anterior fascicular block (LAFB)
The most important clue is a marked leftward QRS axis, usually around −45° or more negative, together with a characteristic QRS pattern.
Typical findings include:
- Left axis deviation
- Small q waves in I and aVL
- Small r waves in II, III and aVF
- QRS usually <120 ms
The key idea:
LAFB shifts the mean QRS axis to the left and superiorly.
2️⃣ Left posterior fascicular block (LPFB)
This is much less common.
The characteristic finding is marked right axis deviation, often around +120° or more, with a narrow or only mildly prolonged QRS.
LPFB is a diagnosis of exclusion because rightward axis deviation has many other causes, including RVH, pulmonary disease and lateral myocardial infarction.
The easiest way to remember them
LAFB = axis goes left
LPFB = axis goes right
And unlike RBBB or LBBB, the diagnosis is made primarily from the frontal-plane limb leads, especially the QRS axis.
Why does this matter clinically?
A fascicular block can occur alone, but it may also occur together with a bundle branch block.
For example:
◼️RBBB + LAFB = bifascicular block
◻️RBBB + LPFB = bifascicular block
The 2021 ESC pacing guideline considers bifascicular block an important marker of His-Purkinje conduction disease, particularly when associated with unexplained syncope.
An isolated fascicular block does not automatically mean a pacemaker is needed. Management depends on symptoms, associated conduction abnormalities and the underlying cardiac disease.
One important caveat
The classic three fascicles model is useful for learning ECGs, but the actual ventricular conduction system is more complex, with branching and interconnections rather than three simple electrical wires.
So use the model to understand the ECG, but don't assume every conduction abnormality fits perfectly into one fascicle.
Bottom line:
- Bundle branch block mainly changes QRS morphology and duration.
- Fascicular block mainly changes the QRS axis.
That is the foundation for recognizing hemiblocks on the ECG.