Understand from Austrian economics perspective how money & liquidity affect the economy & to take advantage of this in your investment decision-making process
Portfolio managers globally struggle deciding when to overweight stocks or bonds. This just got easier with the use of the Liquidity cycle to overweight stocks during the expansion phase and overweight bonds during the contraction phase.
See how it works, how it compares and also check out the current stage of the US cycle along with its allocations: https://t.co/3r27EFHIeE
Now, with another month of data under our belts, we can update our policy rate turning point estimations for the other central banks we cover (as well as updating the RBA model):
US Federal Reserve
European Central Bank
Bank of England
Bank of Canada
Reserve Bank of Australia
Banco Central do Brasil
https://t.co/OIMEGo6AWw
Who's next to hike rates after Australia?
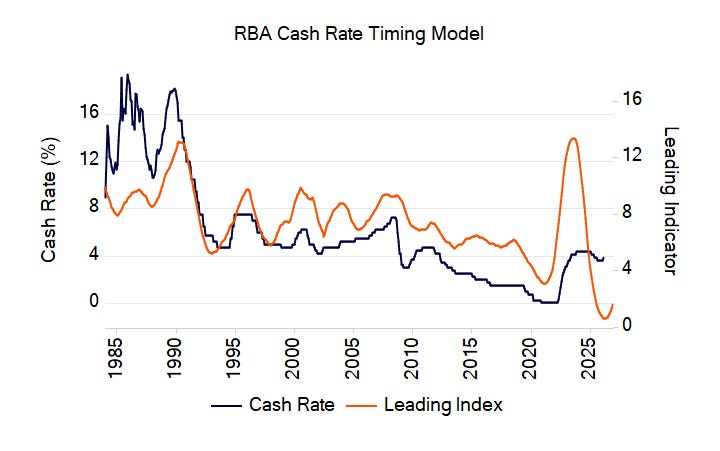
Since last year, we have been highlighting the increasing risk that the Reserve Bank of Australia would reverse policy course in 2026, which hiked this month, in line with our model!
The 2026 rate hikes begin. Australia’s Reserve Bank has kicked off the 2026 global rate hike season with a 25bps increase in its cash rate.
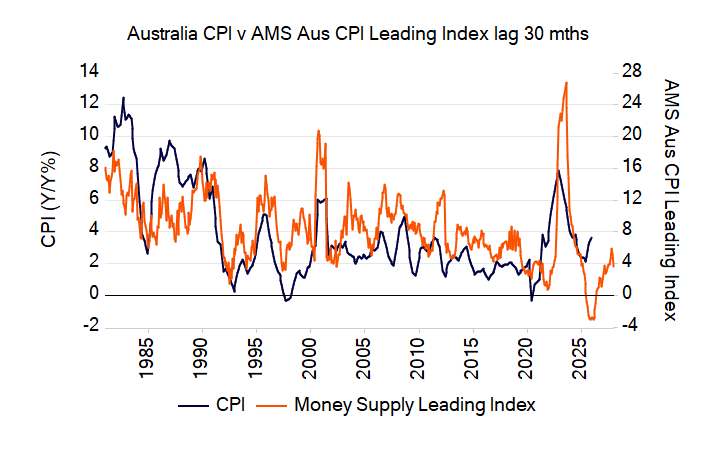
We told subscribers this was coming, and it follows our analysis of the outlook for Australian inflation, which we had been warning about last year.
Booming US money supply growth might help explain the explosion higher in gold and other precious metals prices over the last month. Currency debasement writ large. Source @aaseconomics
https://t.co/Yg98MbJATf
Australia 2026: Modest Growth, Rising Inflation Risks - Our latest Money Supply & Macro Weekly is out now.
Will 2026 see hawks back at the RBA helm?
Is AI a bubble? Read Dr Frank Shostak's latest article
The Essence of Financial Bubbles: The Role of Central Bank Policies
Central bank-driven easy money creates impressive but unaffordable bubble activities that will collapse once the shrinking subsistence fund can no longer sustain them
https://t.co/OyYuROdD64
Our latest weekly note is out.
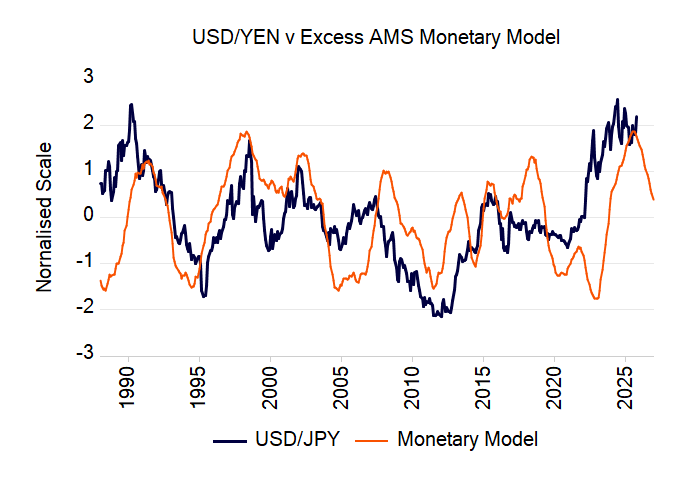
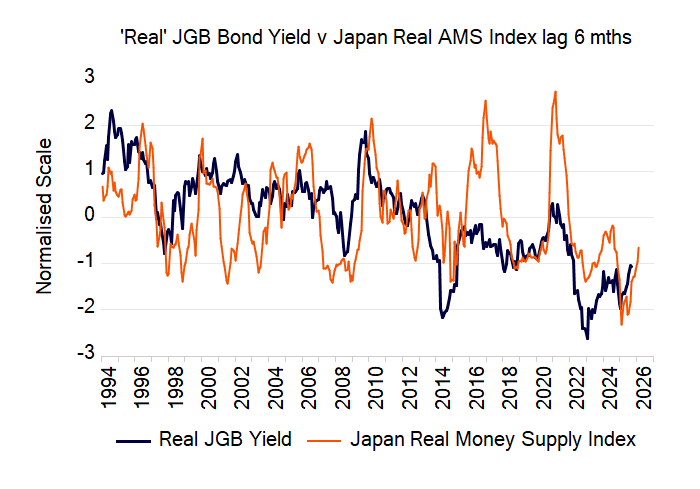
More carry trade angst. The world seems to be obsessed with the risks of capital flooding back to Japan if the BoJ raises interest rates. Really? Find out what the real drivers are and what our monetary model is signaling ahead for the Yen.
Yen Carry Trade Concerns?
In this week’s Money Supply & Macro report, we’re exploring the diverging paths of the Bank of Japan (BoJ) and the Federal Reserve (Fed), and their implications for broader markets and the ever-popular yen carry trade. We’ll compare the economic outlooks for Japan and the US, with a focus on money supply shifts—our Adjusted Money Supply (AMS) as the core driver in our analysis.
Japanese real bond yields look set to continue to rise
For more detailed monetary analysis & its implications towards financial markets & the economy, subscribe to our substack
https://t.co/Qh5ObGibuV
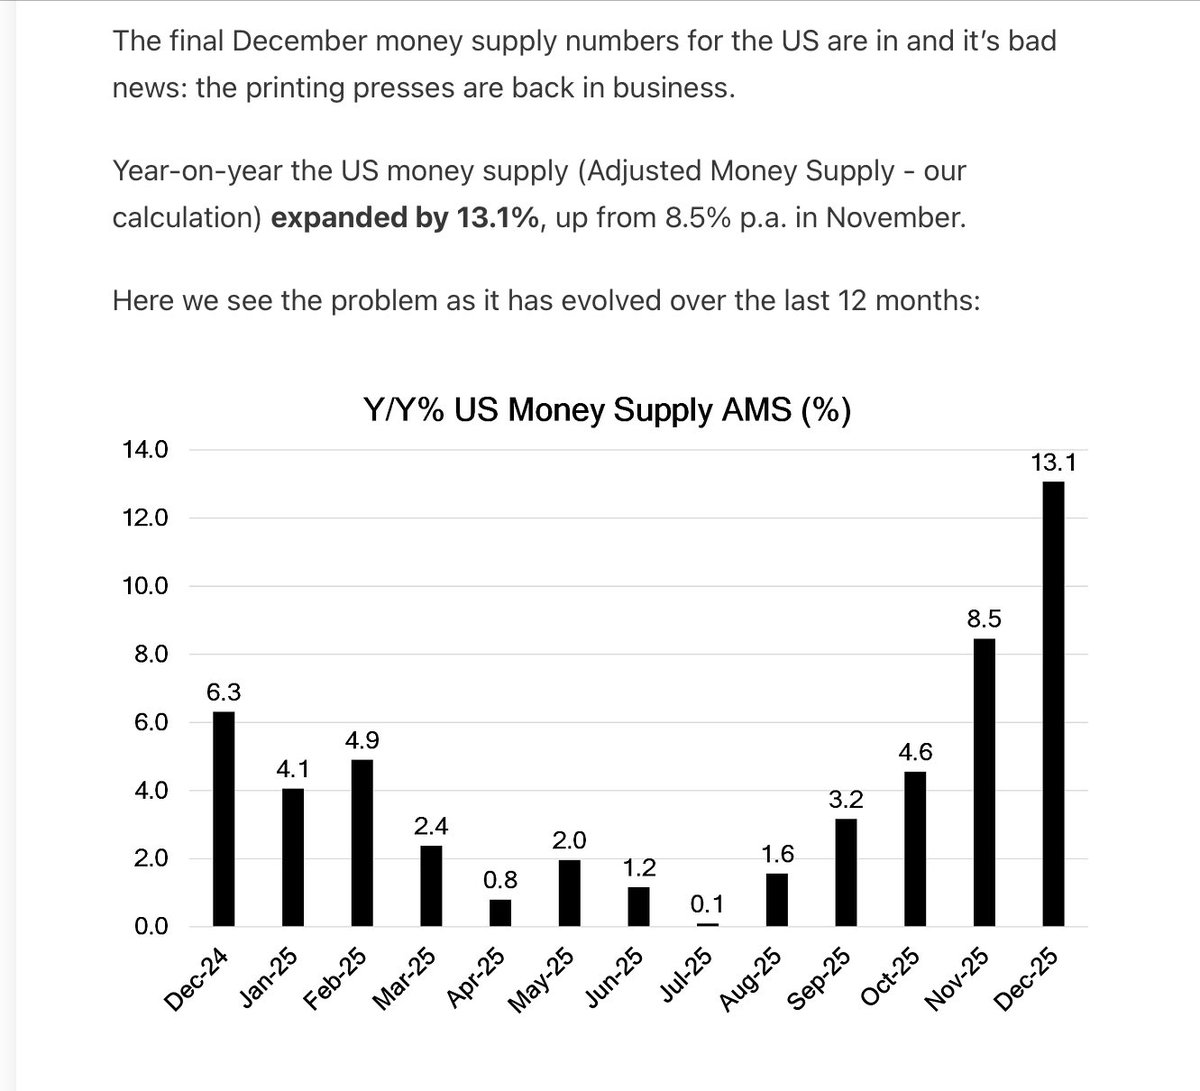
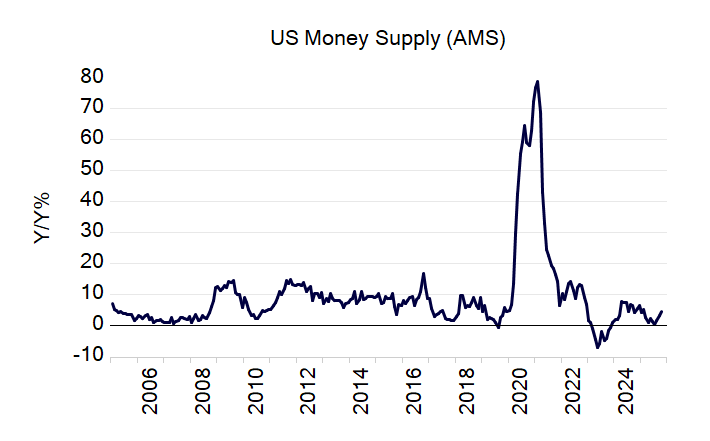
The US money supply was just released for October. For the month, our measure of money supply (AMS) increased by $160 billion. The annual growth rate has now risen to 4.5% from 0.1% in July earlier this year.
Furthermore, in the last 3 months the money supply has risen by over $610 billion!
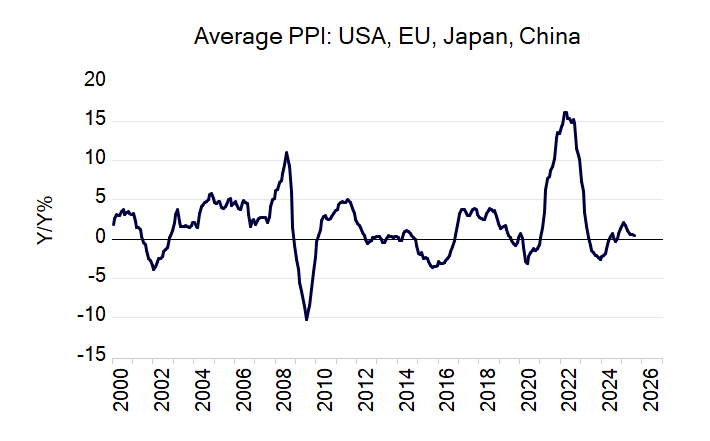
The Great Disinflation is dead!
For more than a year, something big has been happening beneath the headlines: the prices that companies pay for raw materials, energy, and components – wholesale prices – have been creeping up almost everywhere you look.
The era of “beautiful disinflation” that central bankers loved to brag about? It’s over.
🚨New Episode:
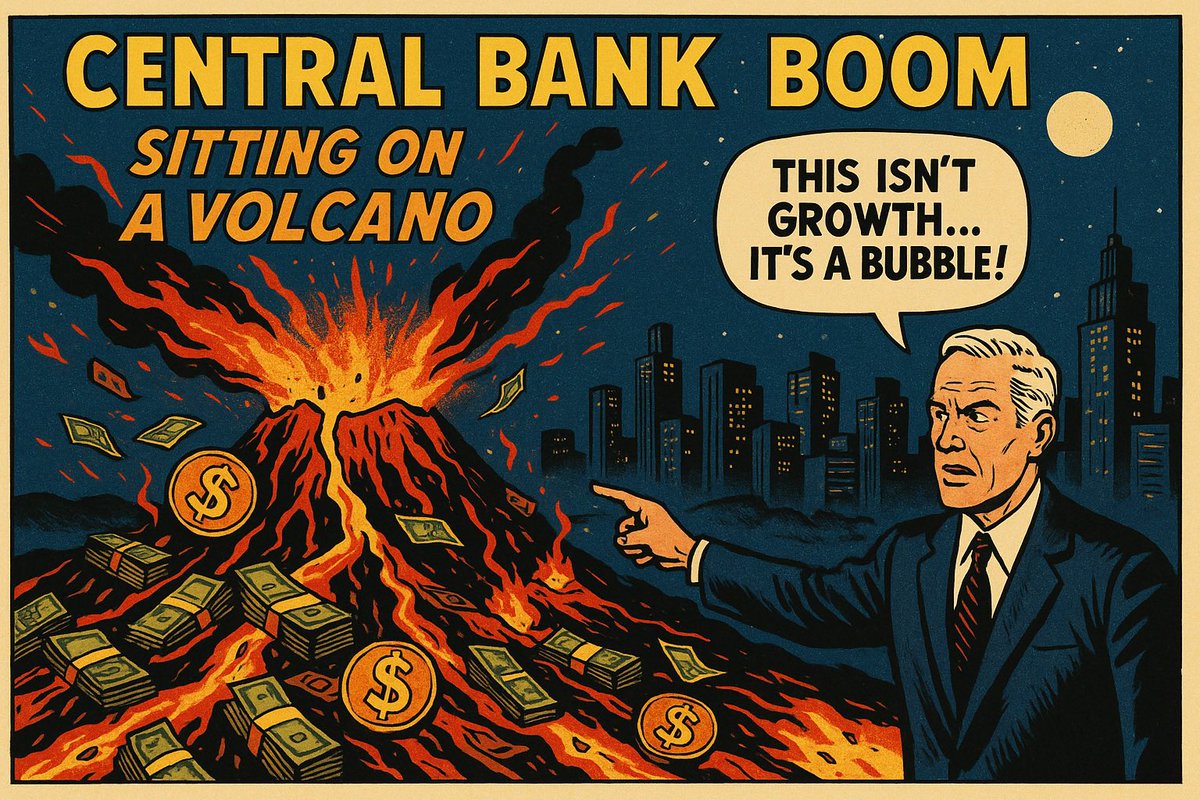
The apparent strength of the economy is a central-bank-fueled bubble, an “exchange of nothing for something” that steals real resources from producers and feeds activities that would not survive without printed money.
🚨New Episode:
The apparent strength of the economy is a central-bank-fueled bubble, an “exchange of nothing for something” that steals real resources from producers and feeds activities that would not survive without printed money.