Bitcoin Looks Vulnerable As Downside Risks Continue To Mount
☕️The Daily by @AayushJs
Bitcoin price extended losses and traded below $60,000 against the US Dollar. BTC tested the $58,000 zone and recently started a minor recovery wave.
Looking at the 4-hour chart, the price settled well below $62,000, the 100 simple moving average (red, 4-hour), and the 200 simple moving average (green, 4-hour). The price started a minor recovery wave above the 23.6% Fib retracement level of the downward move from the $65,531 swing high to the $57,996 low.
However, the bears might remain active below the $62,000 pivot level. On the upside, an immediate resistance could be $60,850. The first major resistance might be $61,500.
There is also a bearish flag forming with resistance at $61,500. The main resistance sits near $62,000 and the 50% Fib retracement level. A close above $62,000 could send the price toward $62,800. Any more gain might call for a test of $65,000.
If there is a fresh decline, immediate support might be $59,000. The first key support could be $58,200. The main breakdown support could be $58,000. A downside break below $58,000 might start another decline. The next major support might be $56,500, below which BTC could decline toward $55,000.
Looking at Ethereum, the price started a consolidation phase and could face many hurdles near $1,620 and $1,650.
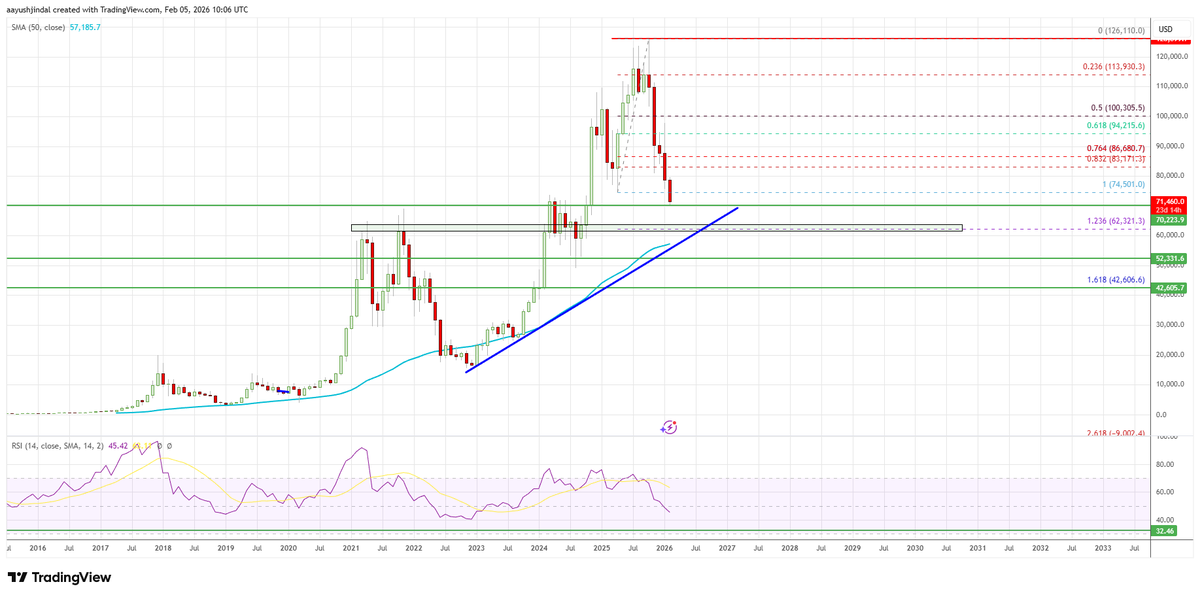
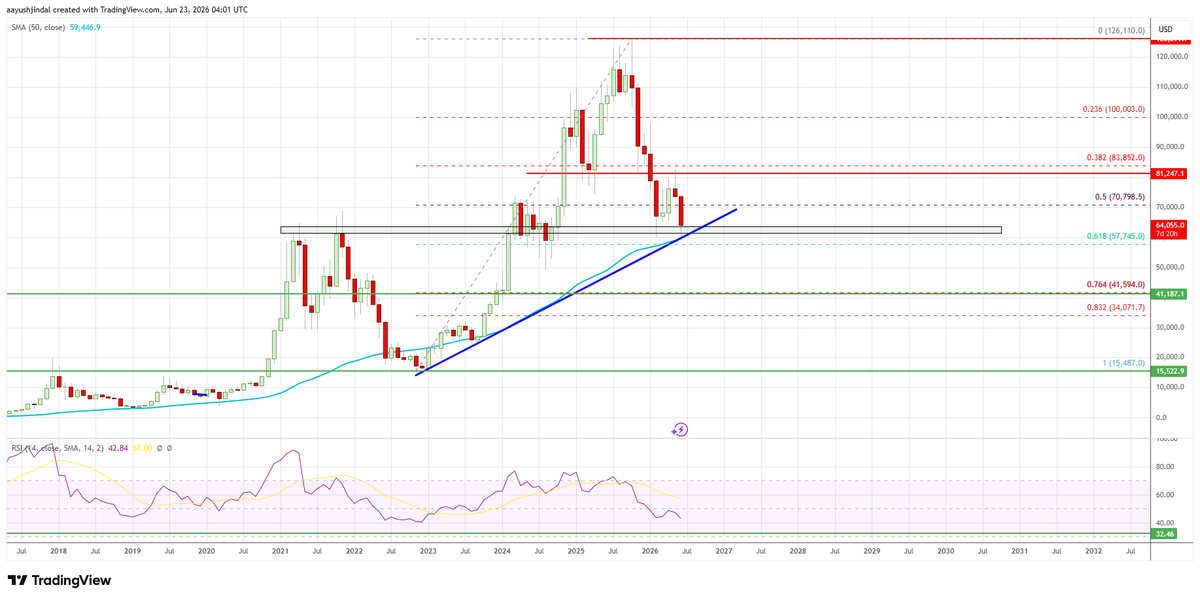
Bitcoin is still above the key trendline support. A weekly close below $57,000 could spark a possible move to $41,500. For Upside, #BTC must settle above $82,000.
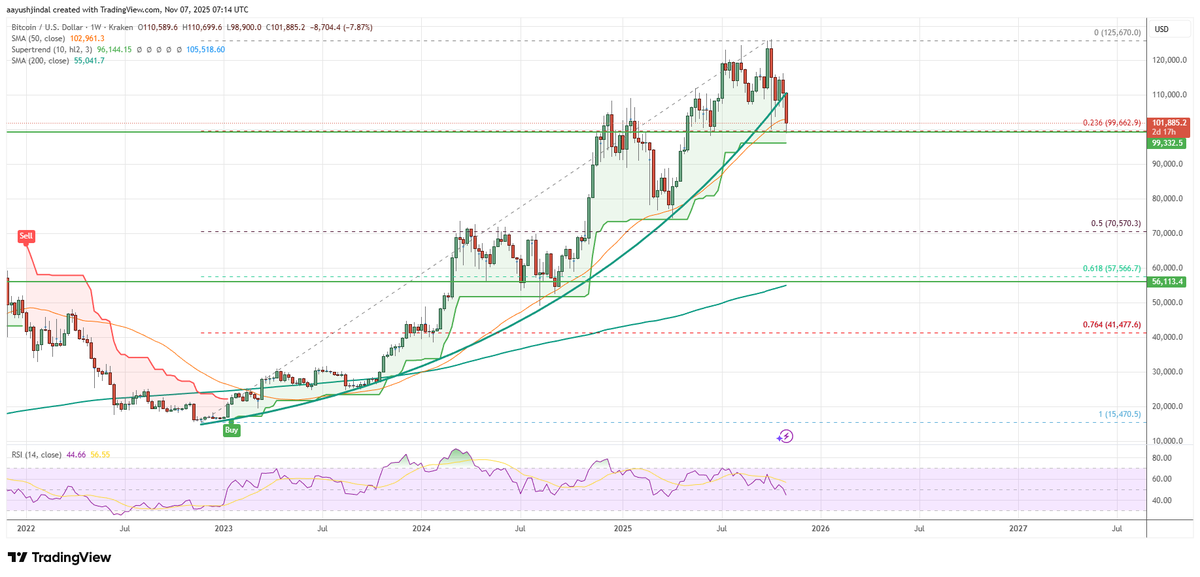
#Bitcoin testing the first logical support after the breakdown below the key parabolic curve. It could correct and recover before downside continuation. If the breakdown is real, we can test $55-$60K in the long run before a fresh uptrend. #BTC#BTCUSD
Ethereum Upside Weakens, Is A Pullback Now Brewing?
☕️The Daily by @AayushJs
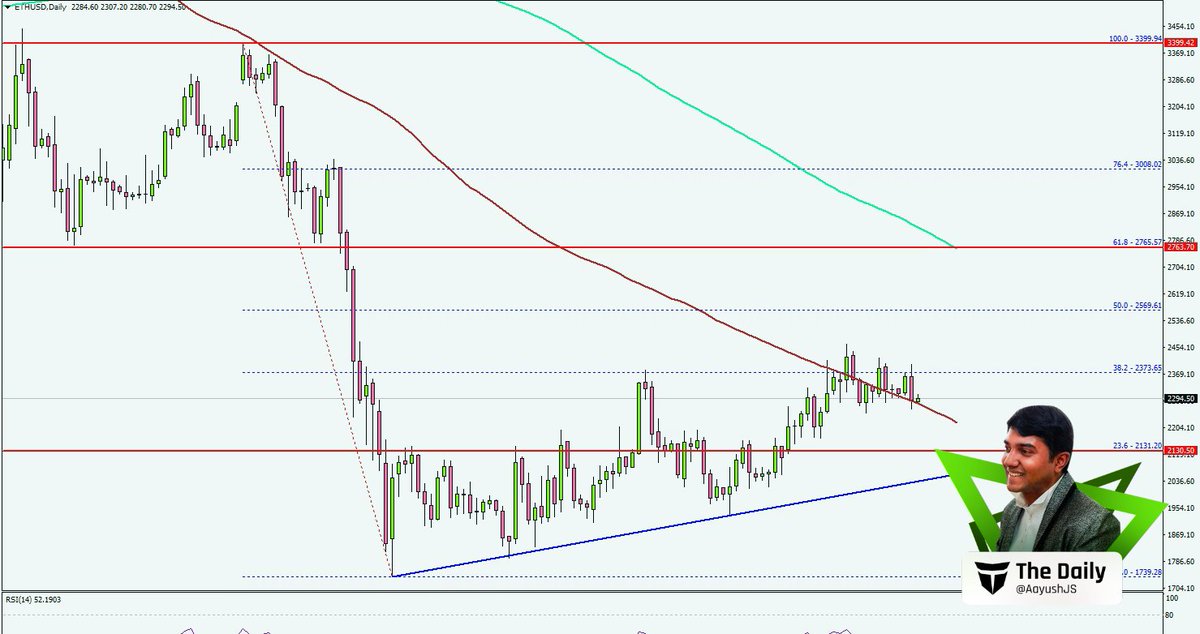
Ethereum started a decent increase above the $2,350 resistance. ETH managed to climb above the $2,400 level before the bears appeared.
Looking at the daily chart, the price failed to settle above the 38.2% Fib retracement level of the downward move from the $3,399 swing high to the $1,739 low. It is now correcting some gains and testing the 100-day simple moving average (red).
On the downside, the bulls might be active near $2,250 and $2,220. The main support is now forming near $2,100. There is also a bullish trend line forming with support at $2,100, below which the price could slide toward $1,950. Any more losses might call for a move toward $1,880.
On the upside, the bears might remain active near $2,400. The first key resistance could be near the $2,450 level. The main hurdle for bulls sits near $2,500.
A close above the $2,500 level could open doors for a larger upward movement. In the stated case, ETH could rise toward the 61.8% Fib retracement level of the downward move from the $3,399 swing high to the $1,739 low at $2,765.
Looking at Bitcoin, there was another recovery wave, but the bears remained active below the $80,000 resistance zone.
@tata_neu Hey team, I tried to make hotel booking via Tata neu app. I made the payment, got message that amount is debited from the card, but app stuck and I did not receive any communication. Please assist ASAP.
Bitcoin Edges Higher, Recovery Signals Early Strength
☕️The Daily by @AayushJs
Bitcoin price remained supported above $65,000 against the US Dollar. BTC formed a base and started a recovery wave above $66,500.
Looking at the 4-hour chart, the price surpassed the 23.6% Fib retracement level of the downward move from the $72,001 swing high to the $64,915 low. However, the bears seem to be active near the $68,500 resistance.
There is also a bearish trend line forming with resistance at $68,500. The price is now well below the 100 simple moving average (red, 4-hour) and the 200 simple moving average (green, 4-hour).
Immediate support sits at $67,000. The first key support could be $66,500. The main breakdown support could be near $65,500. A downside break below $65,500 might start another decline. The next major support is $64,200, below which BTC could decline toward $63,500.
On the upside, the price now faces resistance near $68,500 and the trend line. The first key hurdle is $69,200, the 200 simple moving average (green, 4-hour), and the 50% Fib retracement level of the downward move from the $72,001 swing high to the $64,915 low.
A close above $69,200 could send the price toward $71,500. Any more gains might call for a test of $74,000.
Looking at Ethereum, the price also gained bullish momentum above $2,000, and the bulls could now aim for a move toward $2,200.
@tata_neu This is annoying since I am waiting since yesterday night. Why it's taking this long to check with your finance team? I even called you guys in morning. Time is key here else I would have waited long no worries there but this case needs to be checked with urgency.
@tata_neu You need to understand the gravity of the situation here. It should be checked quickly. My check is 29th. I need booking confirmation or if booking was not done, I need refund details and I will then make a fresh booking. The booking will be of no use if you keep asking time.
@tata_neu Hey please check dm. It's important coz if booking failed, I will need to make a new booking and refund details. If successful, I need booking voucher. Please note, I also paid 498 using neucoins.
Bitcoin Breakout Attempt Builds; Bulls Aim for Trend Shift🔀
☕️The Daily by @AayushJs
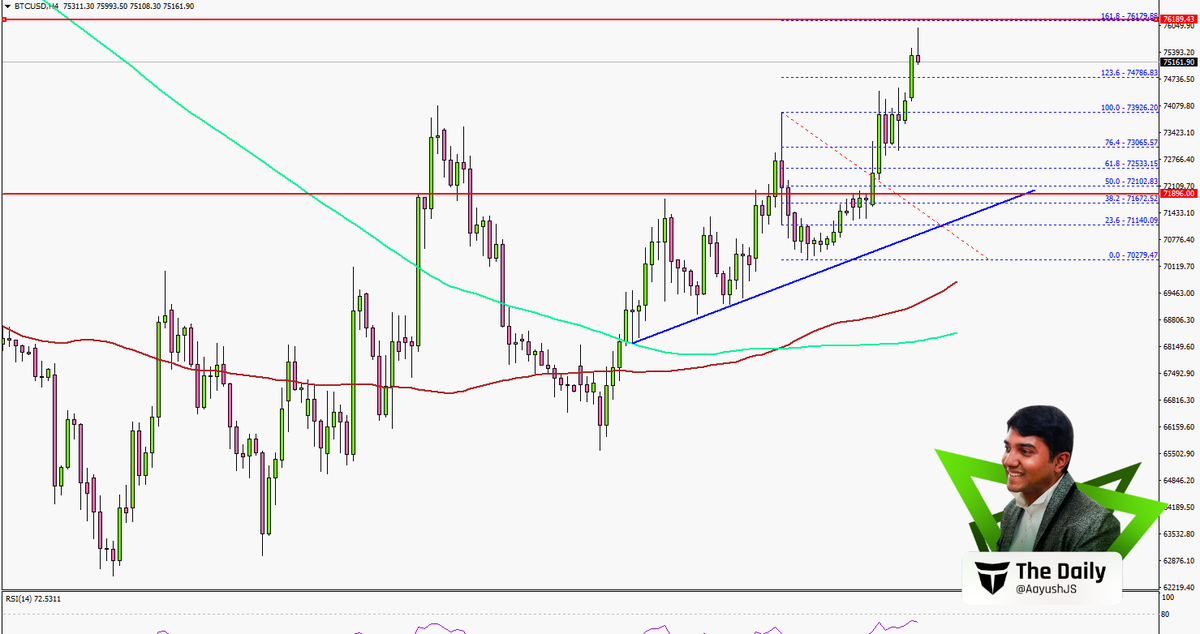
Bitcoin price remained supported above $68,500 against the US Dollar. BTC climbed above $72,000 and $73,200 to enter a positive zone.
Looking at the 4-hour chart, the price settled above the $72,000 pivot level, the 100 simple moving average (red, 4-hour), and the 200 simple moving average (green, 4-hour). The upward move was such that the price cleared the 1.236 Fib extension level of the downside correction from the $73,926 swing high to the $70,279 low.
It opened the doors for a move above $75,000. On the upside, the price now faces resistance near $76,000 and the 1.618 Fib extension level of the downside correction from the $73,926 swing high to the $70,279 low.
The first key hurdle is $77,000. A close above $77,000 could send the price toward $78,800. Any more gains might call for a test of $80,000.
Immediate support sits at $74,000. The first key support could be $72,500. The main breakdown support could be near a bullish trend line at $71,500. A downside break below the trend line might start another decline. The next major support is $70,000, below which BTC could decline toward $68,500.
Looking at Ethereum, the price also gained bullish momentum above $2,250, and the bulls could now aim for a move toward $2,500.
@imYadav31 How flipkart spends count toward Marriott bonvoy points? I can see it in travel section but I am not getting points. Care to walk through steps?
#Bitcoin update - The breakdown was in fact brutal as discussed in Nov 2025. We just hit the first major support at $70K. I still believe #BTC could revisit $62,000 or $55,000 before a fresh uptrend. Swing moves here are there are always on the cards. Trade safe
Many people are pointing this parabolic curve break and turning super bearish, which could be the first sign that bears are slowly losing momentum. Let's see if we can dip to $70K #Bitcoin#BTC