Environmental intelligence offers key strategic insights for companies to plan and maintain operations through complex environmental hazards. Learn more about PwC's climate intelligence solution and the power of location-enabled environmental insights: https://t.co/0TlAULxrsz
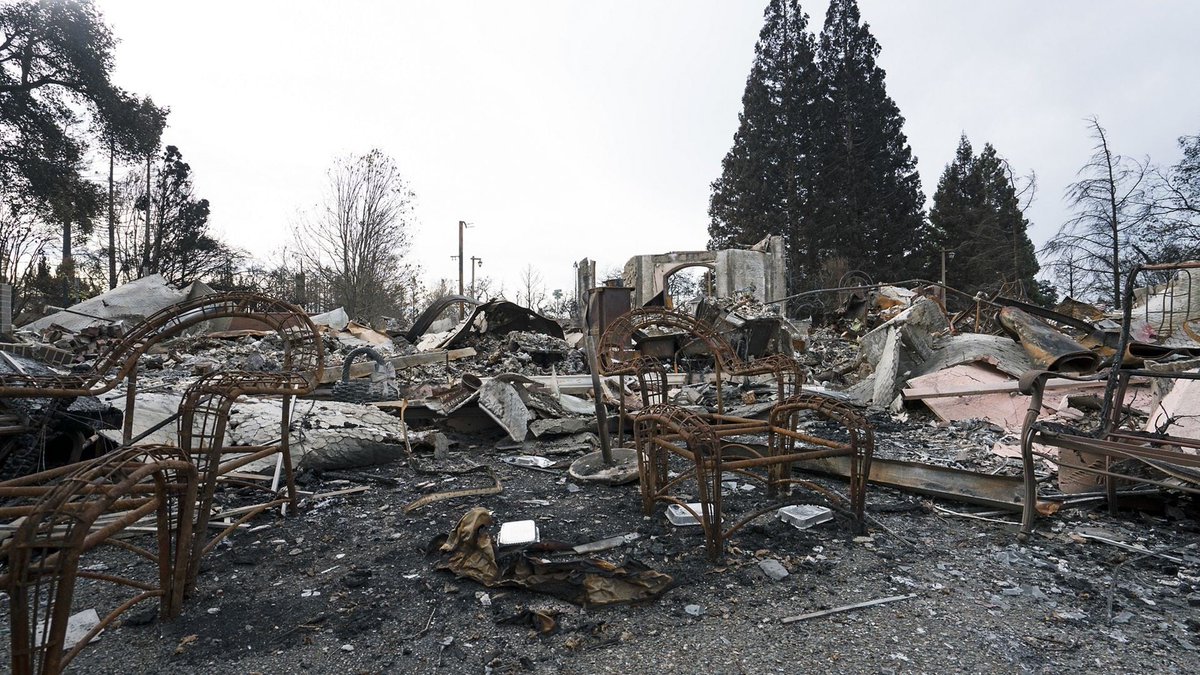
In the wake of disaster, AI models that detect & classify damaged infrastructure + identify potential threats are essential. Esri's updated pretrained geospatial AI model library helps first responders + analysts quickly manage emergency operations. https://t.co/TBHdBdpkeI
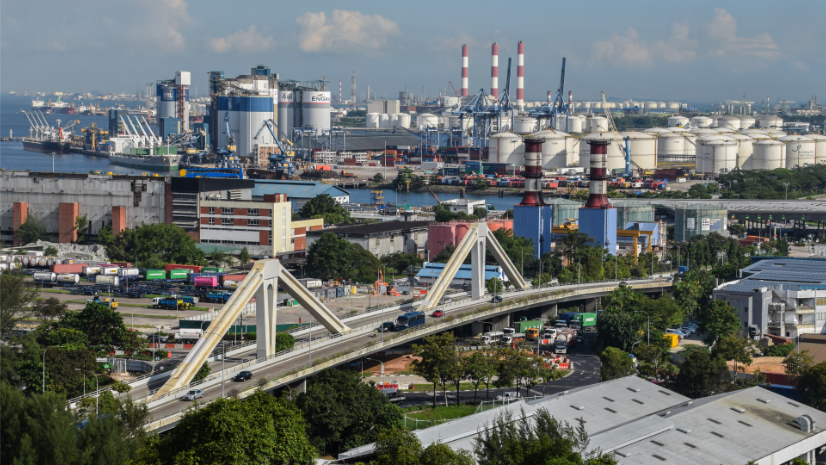
Jurong Port's GIS-powered digital twin, JP Glass, revolutionizes port operations for Singapore by enhancing real-time monitoring, optimizing supply chain management, and promoting sustainability. https://t.co/fSCod1gcLN
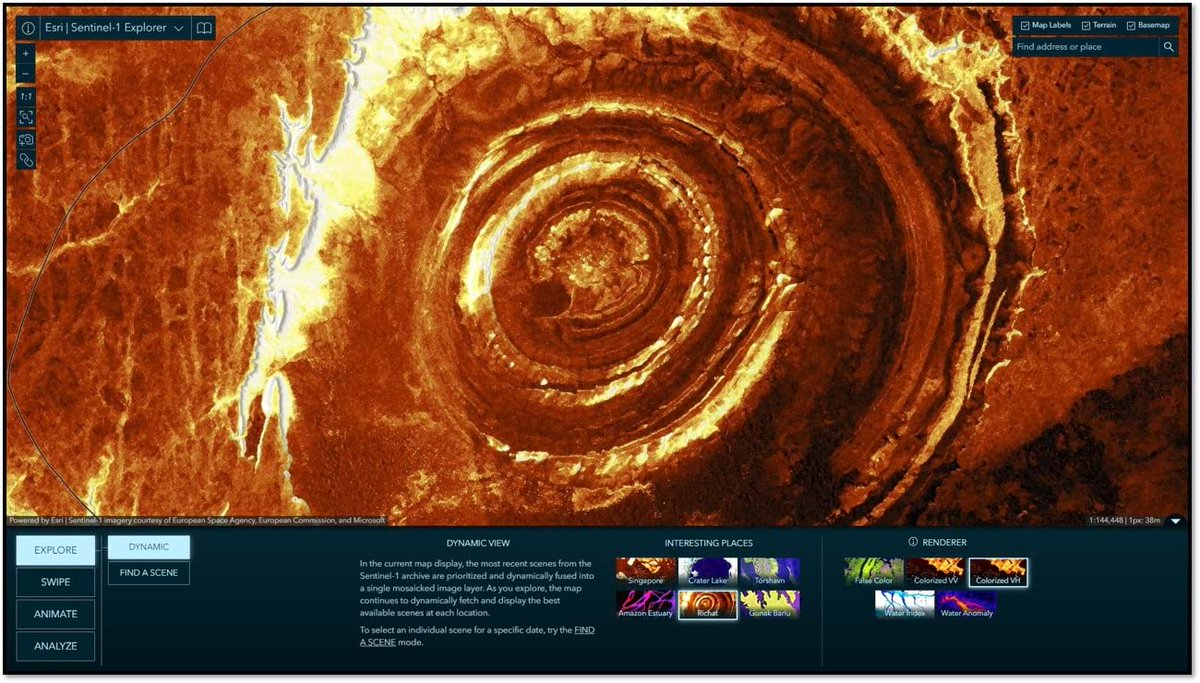
Sentinel-1 Explorer: Observing Earth in a different light. We have added the Sentinel-1 Explorer to our growing suite of ArcGIS Living Atlas of the World Imagery Explorer apps. https://t.co/RQmt5k96Wn
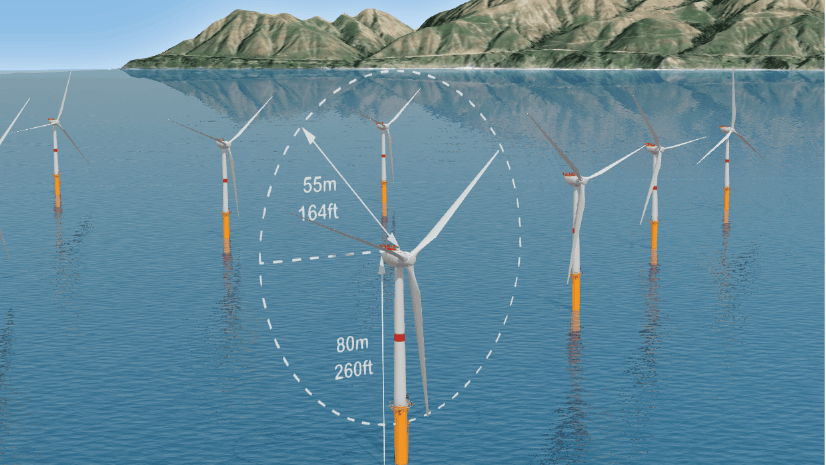
Bring your 3D web applications to life with mesh animations - a new capability in the ArcGIS Maps SDK for JavaScript. Learn how here ➼ https://t.co/CP5uFZeP6W
Approximately 570 million farms are scattered across the world's croplands and rangelands.
How are those farms and commodities distributed? And what are their impacts? Explore #agriculture by the numbers, and beyond, in the August 2024 #StoryScape:
https://t.co/T35VISk8lD
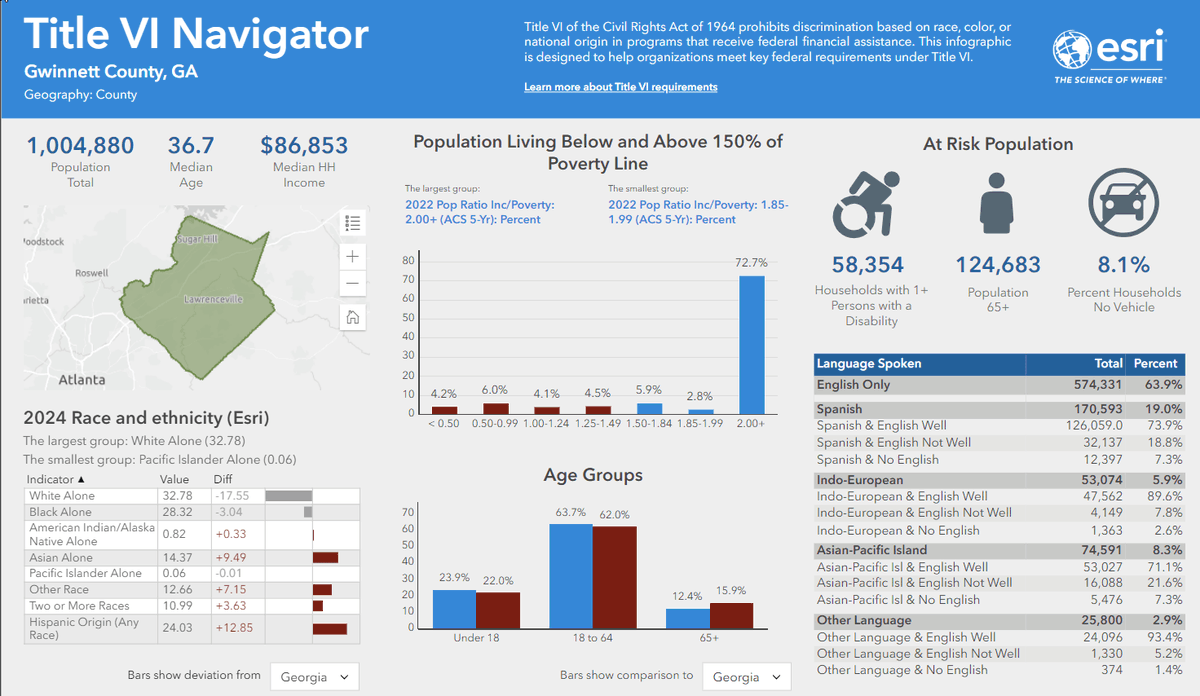
Title VI of the U.S. Civil Rights Act of 1964 prohibits racial discrimination from any org receiving federal $. 𝗘𝘀𝗿𝗶'𝘀 𝗧𝗶𝘁𝗹𝗲 𝗩𝗜 𝗡𝗮𝘃𝗶𝗴𝗮𝘁𝗼𝗿 helps agencies implement it to improve equitable community access to federally funded services. https://t.co/JrKHKKDMXT
With rising climate challenges, urban forests will play a key role in mitigating global warming effects. Certified arborist Paul D. Graham shares his insight on how a geographic approach helps universities manage their campus forests 🌳 https://t.co/U4QyZ6iE2H
Create a Digital Twin in 7 days with the ArcGIS Geospatial Platform! Explore how Zurich created their digital twin from 3D mesh using high-resolution drone, aerial, and satellite images. https://t.co/PPeER1KLYV
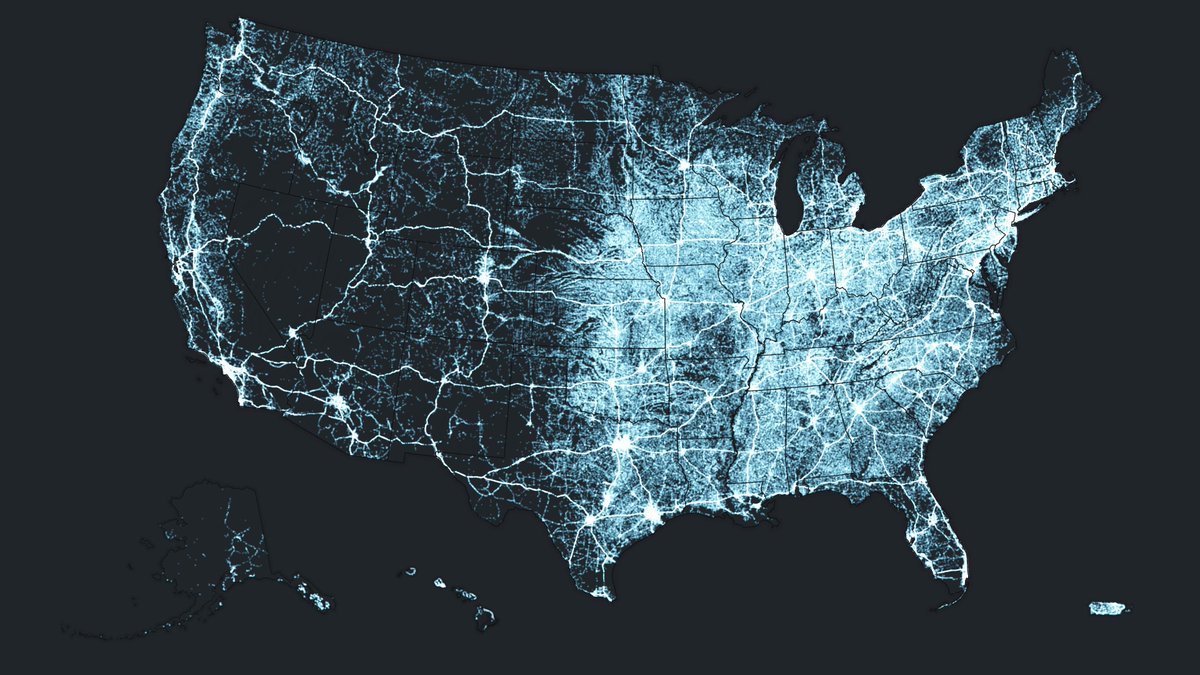
What's the local impact of roads, waterways, and city transit? 🚲
It depends upon where you live.
Explore spatial data behind US #transportation infrastructure and stories about building an equitable, sustainable system. See it in #StoryScape: https://t.co/1SPfemAZai
Stormwater infrastructure management is about so much more than flood prevention or clever flow design. The ArcGIS Utility Network supports multidimensional flow planning that helps you anticipate and simulate end-to-end strategies. https://t.co/EpZUs92INY
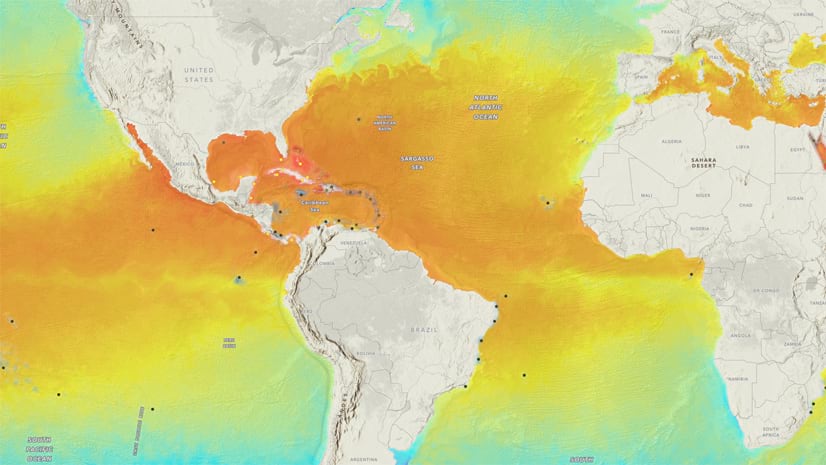
🐠🪸Coral reefs, the “canaries in the coal mine” for ocean health, are at risk of bleaching due to rising temperatures. Thanks to @NOAA’s Coral Reef Watch, we can monitor and protect these vital #ecosystems. Dive into the #interactivemap on #mapsdotcom.
https://t.co/P2NBvkkOr1
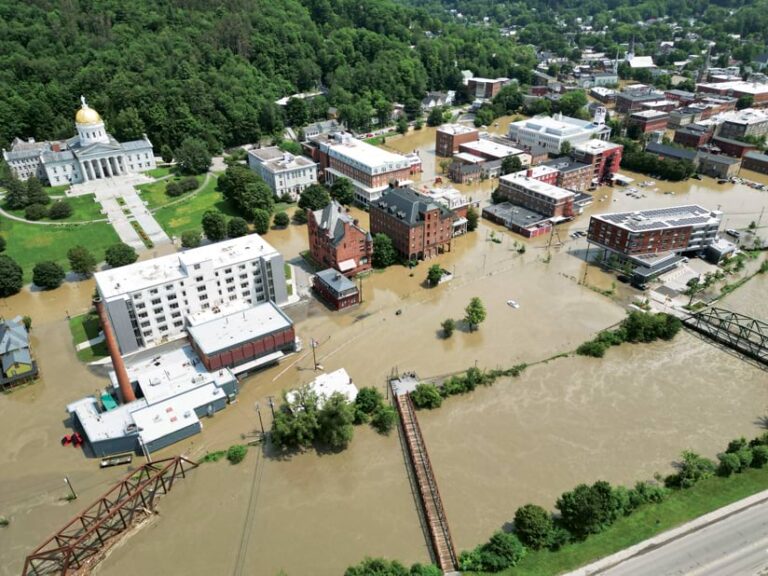
The University of Vermont’s Spatial Analysis Laboratory and its UAS team provided drone support to document the impact of catastrophic flooding from a summer storm. Read this amazing story. https://t.co/qMWUXWiJuK
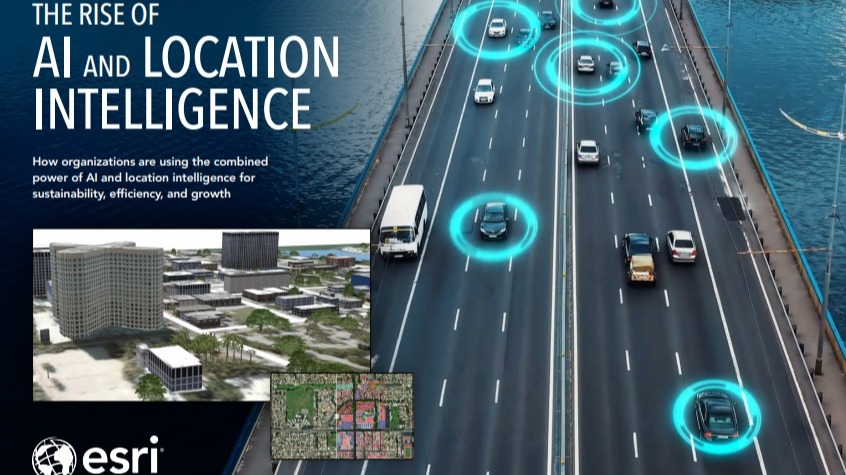
Exceptional collection of case studies on how organizations are using AI and location intelligence for sustainability, efficiency, and growth. Read the ebook. #Esri
Tired of greenwashing, consumers and regulators are demanding proof of sustainability claims. Their scrutiny has inspired a new brand of supply chain transparency https://t.co/I3uVunk8FG
Excellent article by Esri Chief Scientist, Dawn Wright, on GeoAI, and whether the evolving technology can provide new insights such as predicting emerging spatial patterns, or trends in human and natural systems. https://t.co/oHhUmewCjM
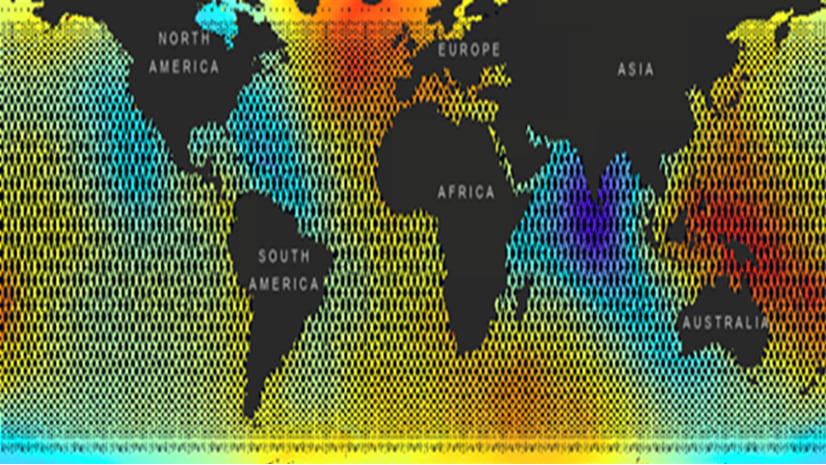
New altimetry data and trajectory datasets in ArcGIS Pro help oceanographers improve our understanding of ocean changes, such as how much the Greenland ice sheet has changed over time. https://t.co/guzbZv6TVy
Heat islands (and their inequitable impact to urban communities) are a hot topic 😎☀️ Learn how to map them with the new tutorial, 𝘔𝘢𝘱 𝘢𝘯𝘥 𝘢𝘯𝘢𝘭𝘺𝘻𝘦 𝘵𝘩𝘦 𝘶𝘳𝘣𝘢𝘯 𝘩𝘦𝘢𝘵 𝘪𝘴𝘭𝘢𝘯𝘥 𝘦𝘧𝘧𝘦𝘤𝘵, based on an #Esri2023UC plenary demo. https://t.co/aU7oPclHVf
🌊 Join me at the Esri Ocean, Weather, Climate Summit on February 12th, where I'll be moderating a panel discussion on GIS for the Ocean. Agenda: https://t.co/vajfDd3N1z