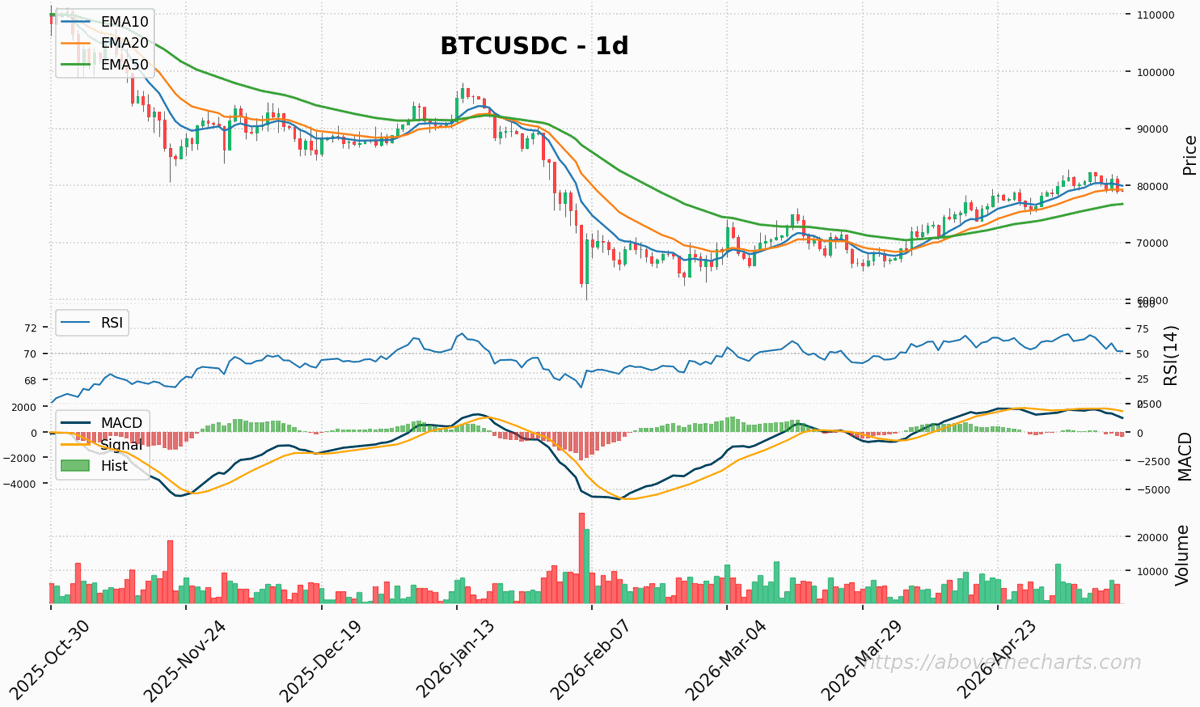
📈 Daily Technical Analysis (clean, consistent, data-driven)
Full breakdowns — detailed levels, trend structure, volatility signals — are on my Substack and currently 100% free:
👉 https://t.co/nhmLJkH0hR
Twitter = quick charts (BTC, ETH, altcoins, SPX, DXY)
Substack = complete analysis (free for now)
No hype. Just structure and clarity.
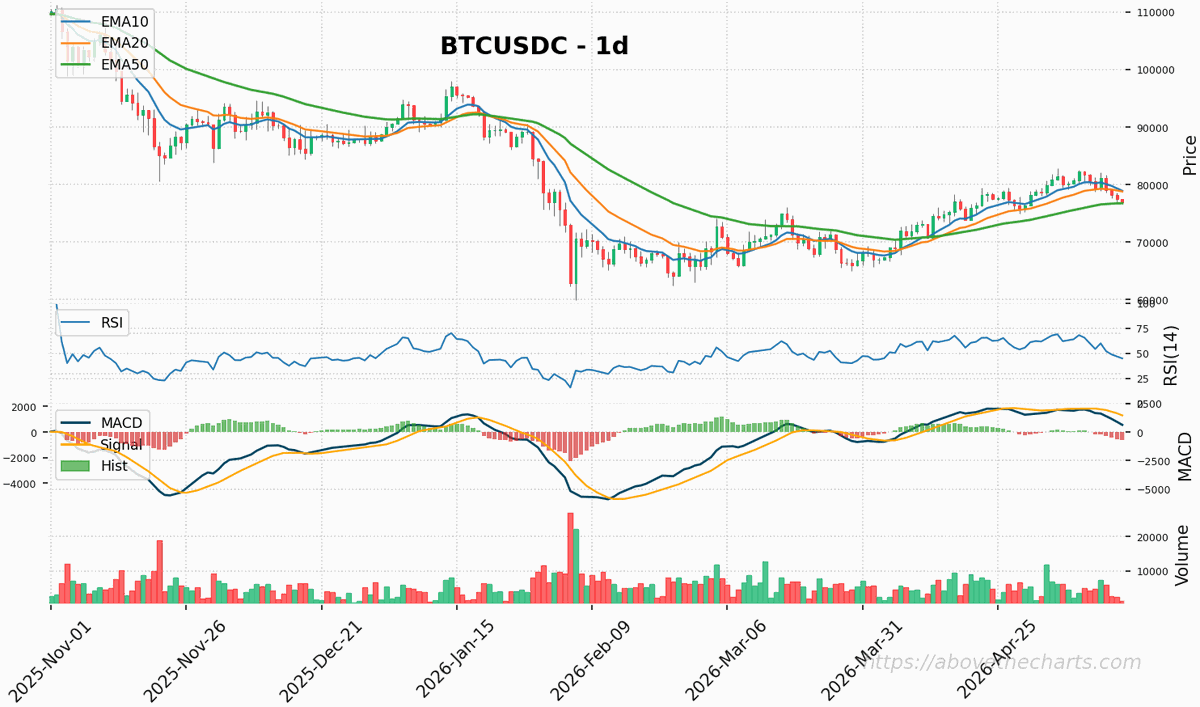
📌 #BTCUSDC currently at ~76,919.99. 🧭 Trend regime: short=bearish, mid=bullish, long=bearish—mixed signals across timeframes. 🧱 Support at 71,288.00, resistance at 87,368.00. 🧯 With RSI/CCI oversold, downside could be limited. Watch for mean-reversion spikes!
BTCUSDC sits just under a weekly pivot/resistance cluster at ~77k, with key fib support at 75.57k beneath. Price trades in 65k-86k range; near-term action pinned to 77k resistance and 75.6-76.3k support. EMA stack bearish, MACD improving, RSI ~60, ADX > 25, ATR ~7.8%.
🧭 #ZECUSDT 1D at ~514.49 🔍 Oscillators are mid-range—momentum is stable. Watch for expansion or a regime shift. 🧭 Trend analysis: short = bearish, mid = bullish, long = bearish. A mixed signal across timeframes! Stay alert!
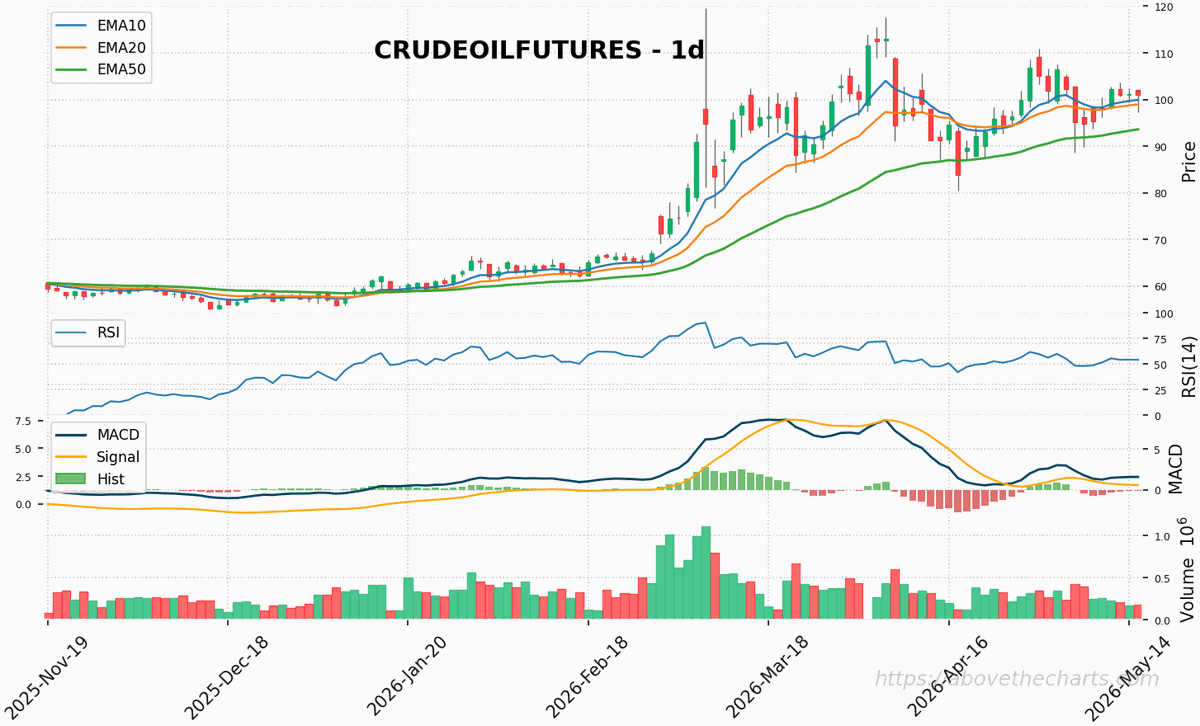
🧠 #CrudeOilFutures trading at 101.02! 🧭 Trend analysis: short & mid-term bullish, while long-term remains neutral. Short/mid align for potential upside, but watch the long-term signals. Stay sharp!
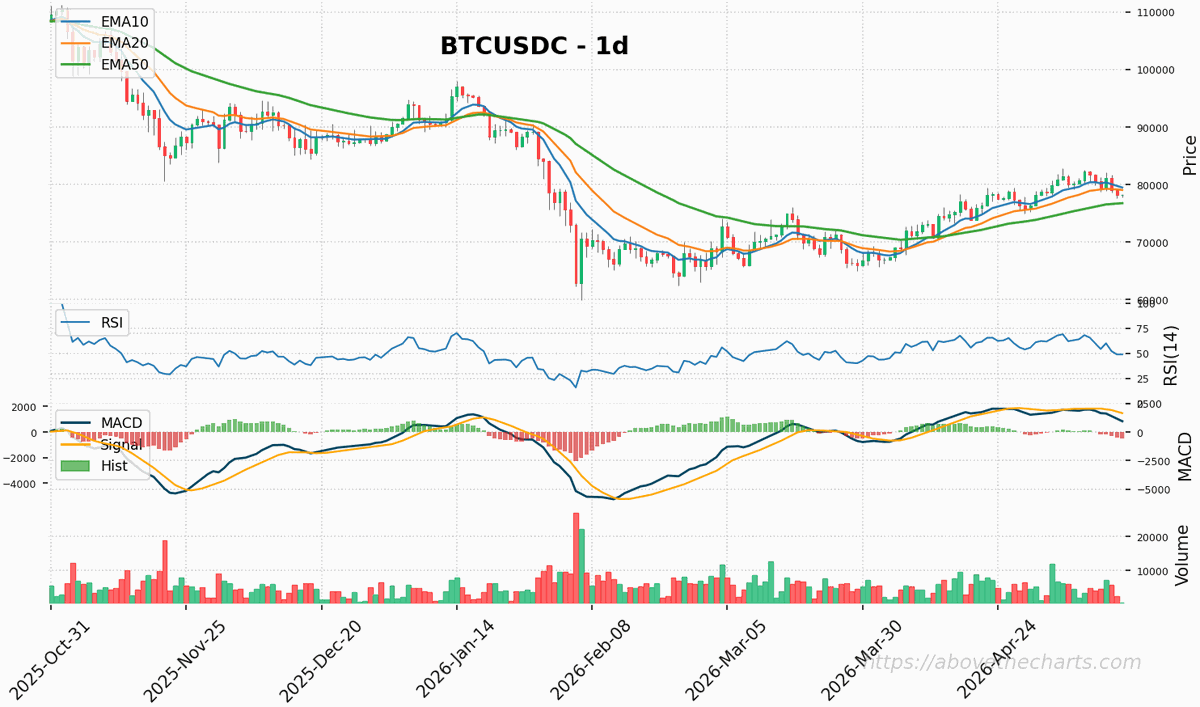
📍 #BTCUSDC 1D spot at 78,133.81 🔍 Oscillators show mid-range momentum—no extremes yet. Await a breakout or regime shift. 🧭 Trend analysis: short=bearish, mid=bullish, long=bearish—mixed signals across timeframes. 🧱 Support at 71,168.00 | Resistance at 87,848.00.
Key levels: 78,019 pivot; swing high 82,846 as a breakout reference. Major support around 71–68k (Fib 0.5–0.618). Volume around 82.8k or 71.3k/70.6k may influence move quality.
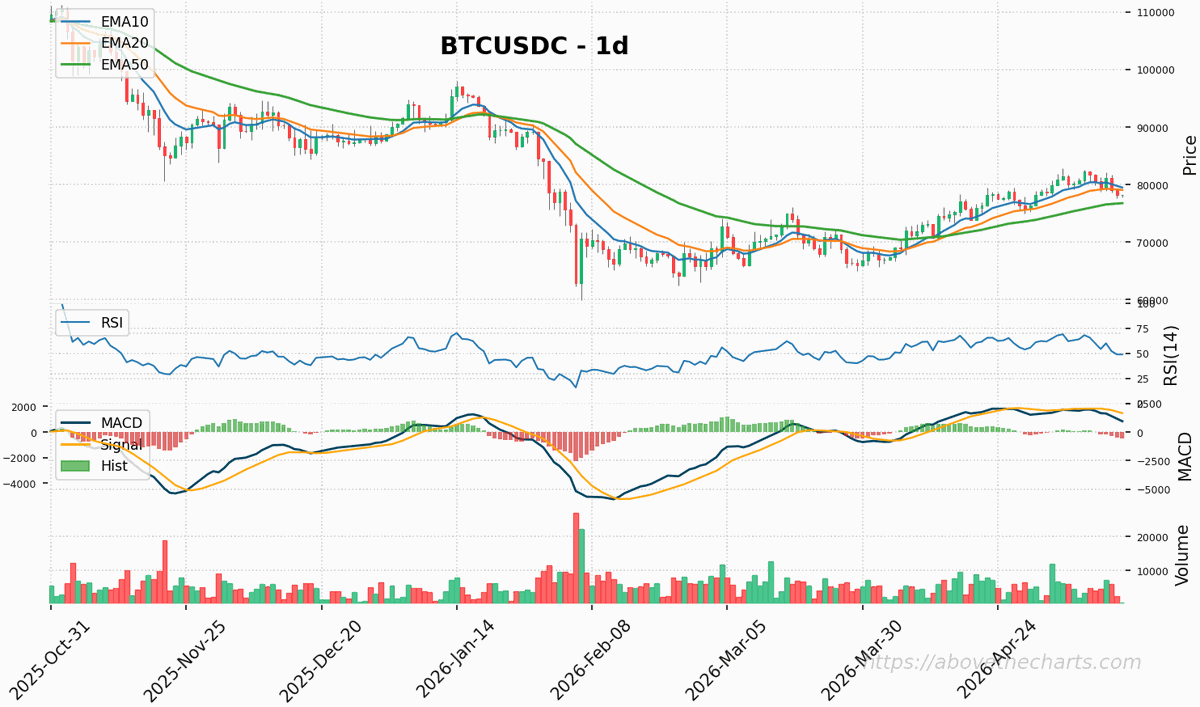
📌 #BTCUSDC 1D price: ~$79,012.26 🧭 Oscillators are in mid-range, indicating momentum is stable. Keep an eye out for expansion or a potential regime shift. Stay sharp!