Sky-high prices? "Two rooftops in London have gone on the market for more than the price of a three-bed terraced house in northern England. The 1,600 sq ft double roof space in Kensington, London, was put on the property market last week for an eye-watering £200,000"
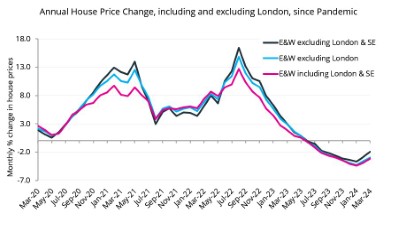
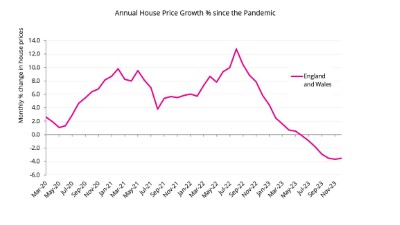
An interesting 4 years- a literal roller-coaster of average house price change. Nevertheless, Mar '24 actual price £46k (15%) higher that at start of pandemic Mar '20. Full detail: https://t.co/6VmZDPZoUF
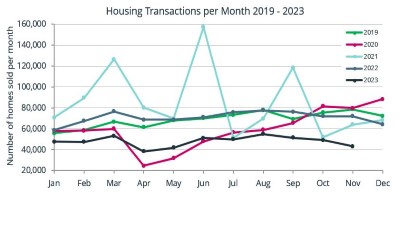
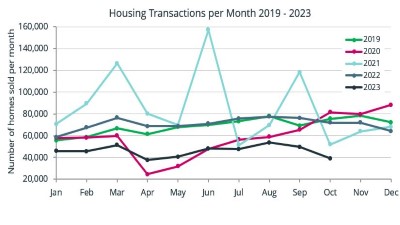
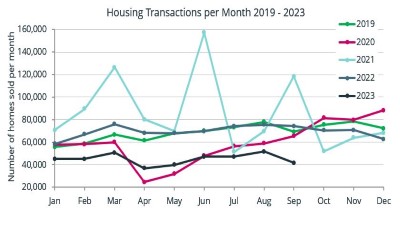
Year 2023- lowest level of monthly housing transactions over 11 months since records began in 1995- 48,000/mnth. Compare with 84,800/mnth in 2021.
Detail: https://t.co/6VmZDPZoUF
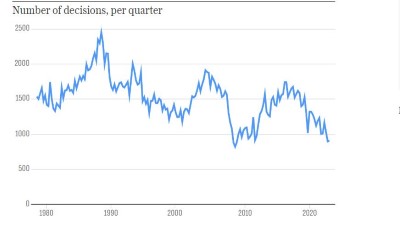
"Between July and September, the number of housing starts – a key lead indicator for future completions – fell by 68pc compared to the previous three months and were down 52pc year-on-year." Planning approval decisions/qtr:
Offices become places to live (again)? So "Work from home" is now "Home is work"? PDR schemes have so far delivered only a small % of outstanding housing requirement...
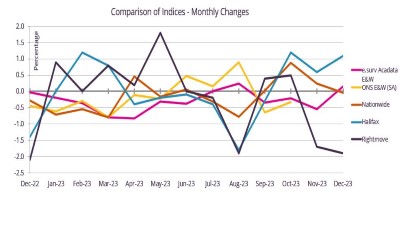
Main annual avg house price change indices all showing upwards trend. Lenders indices show more prominent upward movement. If approx 3-month time lag between lender and Land Registry (recorded sale)-based stats removed, greater degree of similarity.
Jan avg house sale price fell by -3.6% in Jan- but this is less than the -3.9% in Dec- so, onwards and upwards? Jan avg price also up by 0.2%, to £361,029- same level as Feb '22. Only 2nd time in last 15 months prices up by more than 0.1%
A mixed market, with some dramatic extremes in average house prices. In postcode RG9 6 (Chilterns, Bucks), up by 63.5% last year- in NE37 3 (Washington nr Sunderland), down by 53.5%: average price dropped to £34, 074 in 2023. But- prices up in other nearby Washington postcodes...
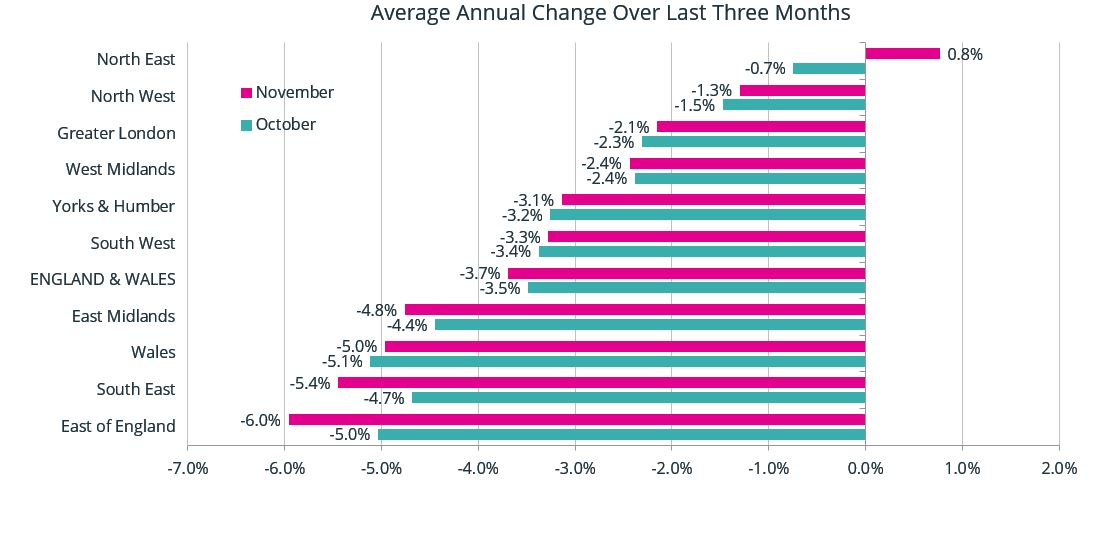
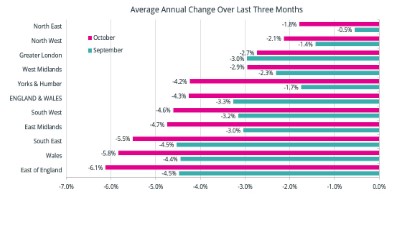
Avg annual house prices over last 3-months, compared to year ago: North East only region with +ve change (+1.5%/ growth +0.8%). Largest fall in East (-1.0%/ decline -6%)- biggest 12-month fall in any region since Oct 2011. https://t.co/dVKYopR1eK
At an avg of just 45,000 transactions/month to end Sept 2023, lowest 9-month level of last 17 years. Total so far for Oct/Nov/Dec= 39K+, but will increase as LR catches up. All recorded sales-based indices affected in the same way. https://t.co/dVKYopR1eK
Monthly house price indices- why do they vary? Timing and methodology. Rightmove= sentiment, 1st to publish. N'wide next, mortgage offer, then H'fax, similarly. Acadata based on actual LR sale date, 3 months after offer? ONS also LR, apprx 2 months later. https://t.co/dVKYopRz4i
Annual average house price growth still negative (-3.5%)- but less so than last month (-3.7%). First time in 16 months that annual rate has improved over previous month. Inc cash and mortgage, England & Wales annual avg sales price now £362,187. https://t.co/dVKYopR1eK
For 2nd month in succession, all countries/regions showing -ve rate of change in annual avg house price. Last time this happened was in June 2011. Details: https://t.co/1onWJc9HpF
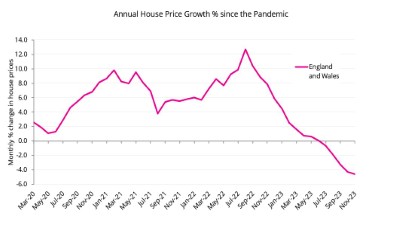
The numbers don't lie- avg '23 price fell by -4.6% in Nov- largest annual fall since Aug '09. Compare with peak growth rate of +12.7% in Aug '22. Avg price now at Jan '22 level. But- view against cumulative +14% rise in actual price since start of pandemic Mar '20.
"... a government that is truly interested in lowering house prices should study ways in which the property market could be subjected to the kind of competition and technological innovation that has been so successful in the car industry."