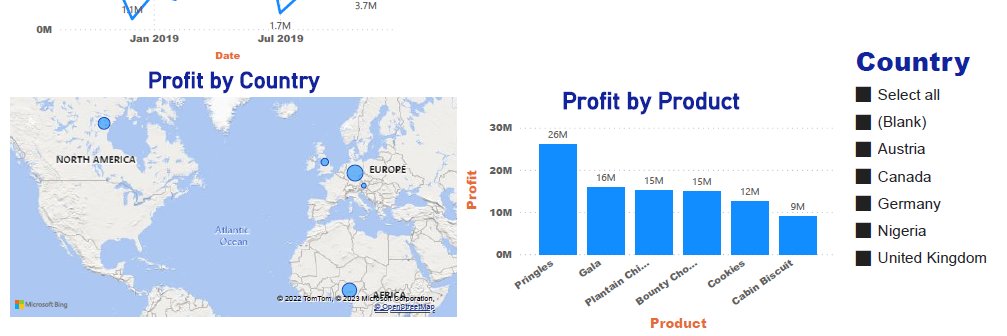
This is one of my project on data analysis using EXPLORATORY DATA ANALYSIS to identify hidden trends, pattern and establish relationship in the sales data of TWA Company which I made up. Some of the steps taken are in the description below.
What do you think please?
https://t.co/oTsh02DQ9k
Welcome to the world of SQL !
In this introductory video, we'll cover the basics of SQL (Structured Query Language) and get you started on your journey to becoming a data manipulation master!
#IntroductionToSQL#LearnSQL#SQLBasics#SQLSkills#SQLGuide
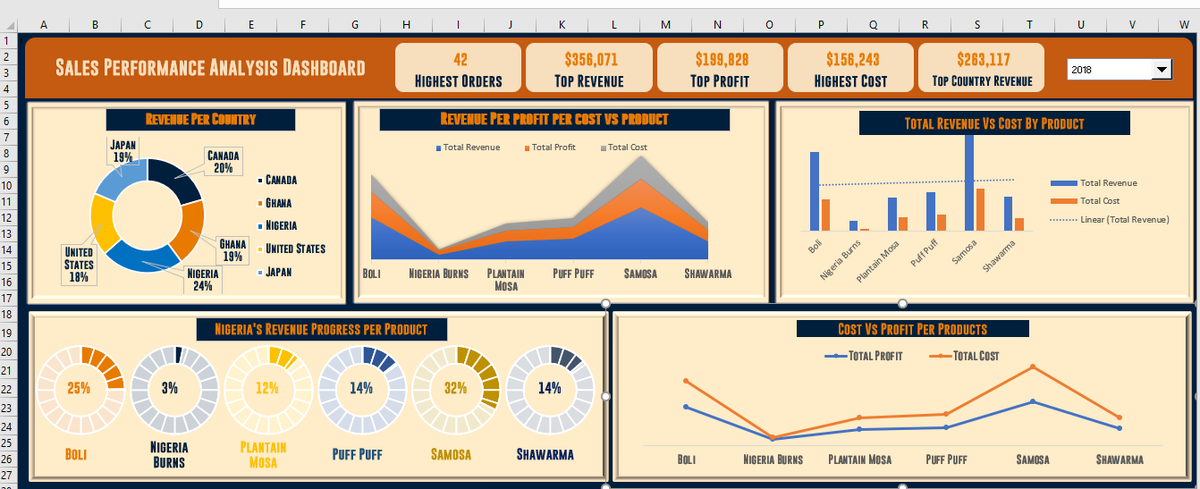
The Ultimate Guide to Creating an Interactive Dashboard https://t.co/0Yi0yy8b5Z via @YouTube
Spice up your excel interactive dashboard with the step by step guide I provide in this video.
#exceldashboad#DataVisualization#DataAnalytics
A guy that drinks and a guy that doesn't drink were asked what influenced their position with alcohol.
1st guy: My father was a drunkard. I looked at him and knew I didn't want that for me.
2nd guy: My father drinks so I naturally took after him.
A polygamous man and a monogamous man were asked why they took that path.
Poly: My dad was polygamous. I didn't want that for me.
Mono: My dad was polygamous.
Do you understand where I am going now?
Your parents having a beautiful/toxic relationship does not guarantee you'll have one too. Being loved at home or not, will not determine the fate of your relationship. You'll have to decide for yourself what kind of relationship you want. You can use your environment as a lesson or an example. The choice is yours. You accept the love you think you deserve.
This also applies to how you raise kids. You can decide to copy your environment because you like how you were raised or disregard it because you loathe it. It is always a choice. Environment gives exposure but you are solely responsible for your choices.
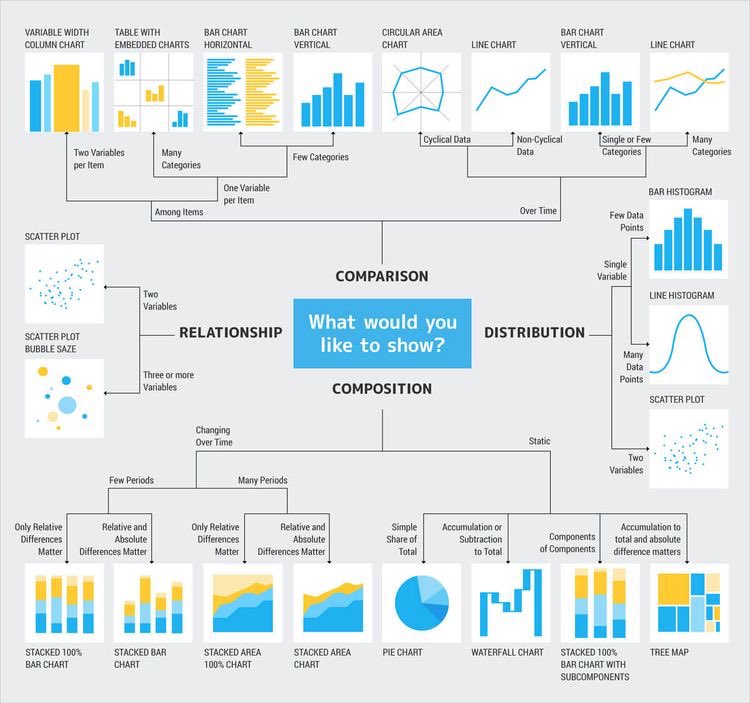
Do you want to describe a single variable ?- use a BAR CHART
Do you want to visualize the distribution of a variable? - use a HISTOGRAM
Do you want to compare the strength of association between 2 variables ? - use SCATTER PLOT
Thread of data visualization.. RETWEET 🙏🏻
@AYOSHEYIFUNMI@Presley_ndifon@renoomokri My brother, all the previous increment in school fees has it translated to any development? Let's always call a spade a spade so we can move from where we are to where we ought to be jare. All our government past and present aren't trying at all and that's the fact.
If you’re interested in LEARNING all of these for FREE:
Product management
Project management
Business analytics
Data visualization
Microsoft excel
Data analytics
Big data
Scrum
UI/UX
Agile
SQL
Open, RT this and thank me later:
https://t.co/946zJFiWth
Hello, Data Nerds👩🏾💻.
This is your sign to remember that your soft skills are as important as your technical skills. Take out time to work and build them as you’re working and building your technical skills.
P.s: thumbs up because you got this and I am rooting for you.
#data
Unlock the Secrets of Data Cleaning in Excel using these simple tricks I shared in this video link I placed below 👇👇👇. Please Like, Share, subscribe and hit the notification bell for subsequent videos. Thanks
https://t.co/0BWqVZucdC