Follower of Christ • just ok former athlete @PortlandBSB trying to be a great #staff coach @GrantBSB • Thrower of ⚾️ • OG Certified at Driveline & Rapsodo
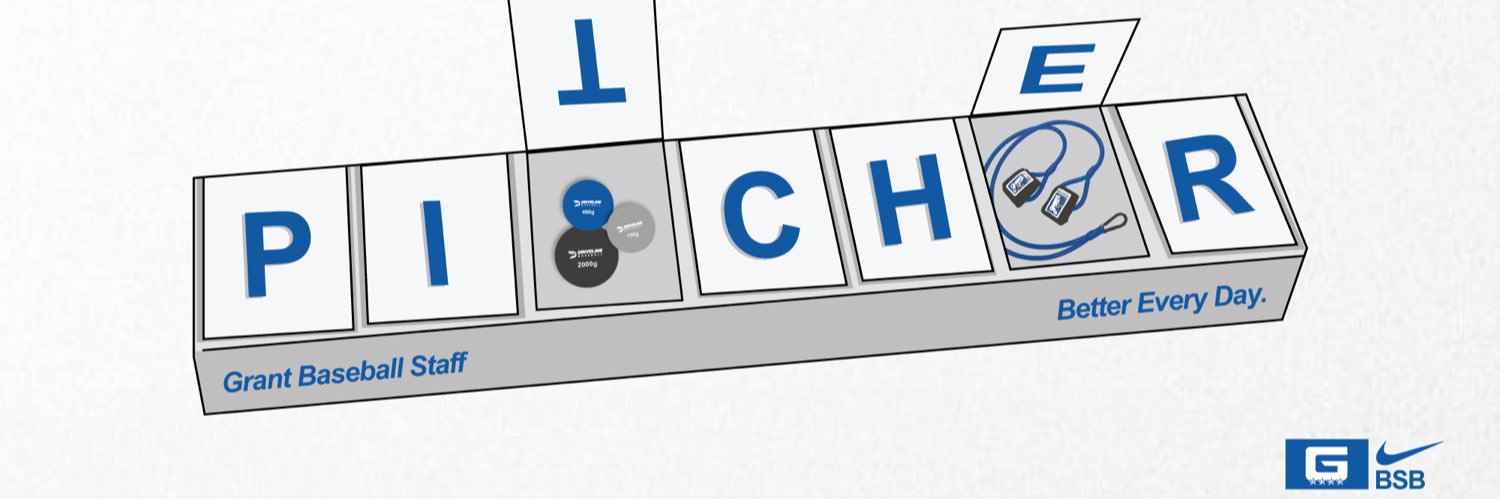
In this spirit, I want to share a resource I made for our Pitchers @GrantBSB
https://t.co/G7pT0upKza
This is everything I have gathered/made I think is useful for a HS/youth pitcher. Arm Care, Pre/Post Throw, Drills, Throwing Programs, Pitch Design & more. Share as you’d like!
Twitter is what you make it. I’ve filled my Twitter experience with people like James Hilts, and it’s made me a better teacher, coach, and person.
This is amazing 👇
Other benefits:
- College style cadence with one extra week of play
- Starting pitchers get more rest
- Have to use more pitchers in a series = real baseball and more competitive
- Rewards teams with depth
- Better viewing and build-up towards a "Final 4 in Omaha"
Who says no?
Why this works:
Total Playoff game count increases to better reflect the % of regular season games that should be played in a postseason.
MIN = 7 games (26% of reg szn)
MAX = 10 games (37% of reg szn)
NBA: MIN = 16 (26%), MAX = 28 (45%)
NCAA BSB: MIN = 14 (25%) MAX = 21 (38%)
A few clips from my last high school baseball game.
Clip 1: my favorite 3 pitch sequence; split, curve, 4-seam
Clip 2: backdoor two-seam
Clip 3: 4 fastballs + slider
BACK TO BACK LEAGUE CHAMPS 🏆🏆
Generals down Wells 9-2 on the back of a CG from @JinkiTomita11 (that’s three straight if you’re counting), 3 big hits from J Fish and @milesbrown26 and 2 more clutch knocks from Phillip Elliston.
#jobsnotdone
Sitting 88-90 with 5 plus offerings. This guys doesn’t get enough credit for what he does.
Going back to 2025 over 87.2 IP he has a 1.04 WHIP, 1.64 ERA and 105 K. Oh and a 7% walk rate. Absolutely dominant. Consistently facing the best teams in the state. #dude
Reason No. 1,000,000,000 to get rid of RPI.
There are so many other more accurate ways to measure the quality of a team, how are we still using RPI in 2026????
(both in college and HS ) @OSAASports
That's because RPI is a flawed ranking method! Full research findings brought to the NAIA coming soon...
Here is my snippet on RPI, lacking some charts and graphics due to X-posting rules.
Primary Criterion 1: The RPI
Of the official metrics, the Ratings Percentage Index is the most familiar and the one with the most damaging mathematical structure. Here is the formula:
RPI = WP × 0.25 + OWP × 0.50 + OOWP × 0.25
WP is the team’s winning percentage. OWP is the average winning percentage of the team’s opponents. OOWP is the average winning percentage of the team’s opponents’ opponents. Strength of Schedule is reported separately as OWP × 0.67 + OOWP × 0.33.
Flaw 1: 75 Percent of the Rating Is About Other People
A quarter of a team’s RPI captures what that team did. The remaining 75 percent captures what the teams it played did, and what the teams those teams played did. The intent was to encode the strength of schedule. What actually happens is that any structural distortion in opponent winning percentages gets a three-to-one amplifier on the final number. As the Mechanism section will show, the amplifier hits the West region directly.
Flaw 2: Two Degrees of Separation Are Insufficient
RPI’s formula stops at OOWP, two steps removed from the team being rated. With 188 NAIA baseball programs, five regions, and 18 conferences, two degrees is mathematically insufficient to connect the league’s full schedule network. Boyd Nation, who has maintained the Iterative Strength Rating since the 1990s, summarized the problem in his published FAQ:
“in sections of the country with fewer Division I baseball schools, such as the West, the pool of available opponents tends to be smaller, which tends to pull winning percentages towards .500. As a result of the RPI only considering two levels of interconnectedness, teams from these regions tend to be underranked by the RPI’s.”
Iterative systems like ISR and Massey solve this by computing every team’s rating at once and propagating connections through the entire schedule network until the values stabilize. RPI does not iterate. Whatever distortion exists at two steps stays at two steps.
Flaw 3: No Margin of Victory
A 1-0 extra-inning win and a 14-2 blowout count are identical in RPI. Every published statistical study of rating systems has reached the same conclusion: systems incorporating margin of victory predict future outcomes better than systems that do not. The NCAA Division I men’s basketball committee retired RPI in 2018 in favor of the NCAA Evaluation Tool, which incorporates scoring margin, offensive and defensive efficiency, and quality of wins. The NCAA’s published rationale stated explicitly that NET considers “game results, strength of schedule, game location, scoring margin, net offensive and defensive efficiency, and quality of wins and losses.” Four of those six inputs are absent from RPI.
The NAIA baseball committee has not made this change. NCAA Division I baseball, after extensive discussion at the 2024 ABCA Convention in Dallas, retained the RPI formula but added the Kevin Pauga Index as a supplementary, non-selection tool plus a quadrant view. NAIA baseball has done none of this.
Flaw 4: Miscalibrated Home and Away Weighting
The post-2013 RPI weights road wins at 1.3, home wins at 0.7, road losses at 0.7, and home losses at 1.3. Those weights assume home teams win approximately 70 percent of the time. That figure is roughly correct in basketball. It is not the home win rate in college baseball.
A 2021 study from the Samford University Center for Sports Analytics, which examined more than 4,000 in-conference college baseball games from 2015 through 2019, found that the actual in-conference home winning percentage runs between 55 and 60 percent. The same study concluded:
“we would argue that the RPI model for college baseball should be adjusted to give less weight for a road win, possibly 1.2 / 0.8 or 1.1 / 0.9.”
The implication is direct: RPI overvalues road wins relative to actual home-field advantage in college baseball. The miscalibration is likely larger in NAIA, where travel distances and facility differences depart further still from the basketball assumption.
Flaw 5: Perverse Incentives at the Margin
Because 75 percent of RPI is opponent records, beating a weak team can lower a team’s RPI. The win adds to the team’s WP, but it also adds a loss to that opponent’s record, which lowers the opponent’s winning percentage and pulls down the team’s OWP. The same arithmetic works in reverse: losing to a strong team can raise a team’s RPI by raising the opponent’s record. Rational scheduling strategy, therefore, is not “win as many games as possible” but “play opponents who are good enough to elevate your OWP but beatable enough that you can still win.”
A well-designed ranking system should make schedule optimization impossible. RPI is so optimizable that scheduling has become part of how programs build resumes.
Flaw 6: The Documented Quantitative Bias
To test the RPI’s regional behavior, we computed an RPI bias score for each team in the top-100 RPI cohort. The bias score is RPI rank minus the average rank assigned by four independent rating systems: Boyd’s World ISR, College Baseball Report, Pear Ratings, and Massey Ratings. Positive values mean RPI ranks the team worse than the predictive consensus does. Negative values mean RPI ranks the team better.
My study shows West teams have an RPI bias of +23.2 spots, compared to +1.3 in the North, East, and Midwest, and -1.3 in the South.
Statistical tests on these results:
Mann-Whitney U test, West versus non-West: U = 263, p = 0.0002. Under the null hypothesis of no regional difference, the probability of observing a gap this large or larger is approximately 1 in 5,000.
Mann-Whitney U test, West versus South only: U = 151, p = 0.0006.
Bootstrap 95 percent confidence interval for the West mean bias: [14.8, 35.2]. Even at the lower bound, West teams are ranked roughly 15 spots worse than their consensus position.
The visualization below makes the team-by-team disagreement visible. Teams above the diagonal are ranked worse by RPI than by predictive consensus; teams below the diagonal are ranked better.
The West region’s average team in the top-100 RPI has a true ranking 23 spots higher than where RPI places it. The South region, by contrast, sits within 1.3 spots of its consensus position. No other region shows a comparable distortion in either direction. This is signal, not noise.
Flaw 7: Predictive Systems Agree With Each Other More Than RPI Agrees With Any of Them
Spearman rank correlations among the four independent rating systems run high, with a median pairwise correlation of approximately 0.86. RPI’s correlations with the same systems are lower in median terms:
The four predictive systems correlate with each other at values between 0.78 and 0.96 (median 0.86). RPI’s correlations with the same four systems fall between 0.68 and 0.90 (median 0.71). The single highest RPI correlation (ρ = 0.90 with ISR) is itself an outlier within the RPI row: RPI agrees most strongly with ISR specifically because ISR is the only one of the four predictive systems that does not use margin of victory. Strip ISR out of the comparison, and RPI’s correlation with the other three predictive systems falls to a 0.69-to-0.73 range, well below the 0.87-to-0.96 range those three systems show with each other. RPI’s lack of margin-of-victory data accounts for most of its disagreement with predictive systems that do use it.