I have this theory that the way you dress isn’t nearly as important as people’s historical perception of how you dress.
For example, if people think you usually dress poorly, they will still think that even if you wear something nice.
Same goes for people who historically dress well. They can pull off anything, even if it’s funky.
California didn’t even have slaves!
Why is it right for someone who escaped tyranny in other countries and happens to live in SF to pay “reparations” for something they had nothing to do with?
This is deeply morally wrong.
R2000 threatens to underperform S&P 500 in majority of days for third consecutive year. The R2000 has underperformed the S&P 500 in most days for seven of past nine years. Even if the R2000 outperforms every day for the rest of the year, ’25 will mark the third consecutive year where the R2000 will underperform the S&P 500 in a majority of days for the year. It will also be the seventh out of the past nine years where this was the case. Prior to 2019, the R2000 had never posted three consecutive years where it underperformed the S&P 500 in a majority of days. Now we have had two such three-year periods. The only comparable stretch was the eight years ending 1990 when five out of eight years showed the R2000 underperform the S&P 500. The good news is that the next four years back then were quite good for small-caps, rising at a 19.2% annualized rate and outperforming by over 730 bps per year on an annualized basis. The R2000 also tends to outperform after two-plus years of annual % of days underperforming. Nominal returns also tend to be strong. Only after ’18 (and ’25 is current relative returns hold) did the R2000 underperform in the forward year.
’25 Likely Ends as Uncharacteristic Ninth Straight Year Below 50% for the Percentage of R2000 Stocks Outperforming S&P 500. The percentage of R2000 stocks outperforming the S&P 500 equals 38%, up from 28% on 6/30/25. But while higher than at mid-year, 2025 will likely end as the ninth straight year below 50%. Prior to 2011, the percentage of R2000 stocks outperforming the S&P 500 was above 50% about half the time – since then, it has occurred in only two years: 2016 and 2013. To say small-caps are due for a good year is an understatement.
If Jay Powell's recent presser statement is correct that payrolls are overstated by 60k per month, then today's non-farm payrolls adjust to a modest 4k. Bond friendly. Would be consistent with today's 0.2% jump in unemployment and flat Oct. retails sales. Consistent with easier monetary policy, and today's modest BTC strength.
Failed BTC Oct. 6th downtrend eclipse. Increasingly likely the lows have to be retested. Most BTC bottoms have taken 8 to 11 weeks. Looks like this one will be no different. Another disappointment.
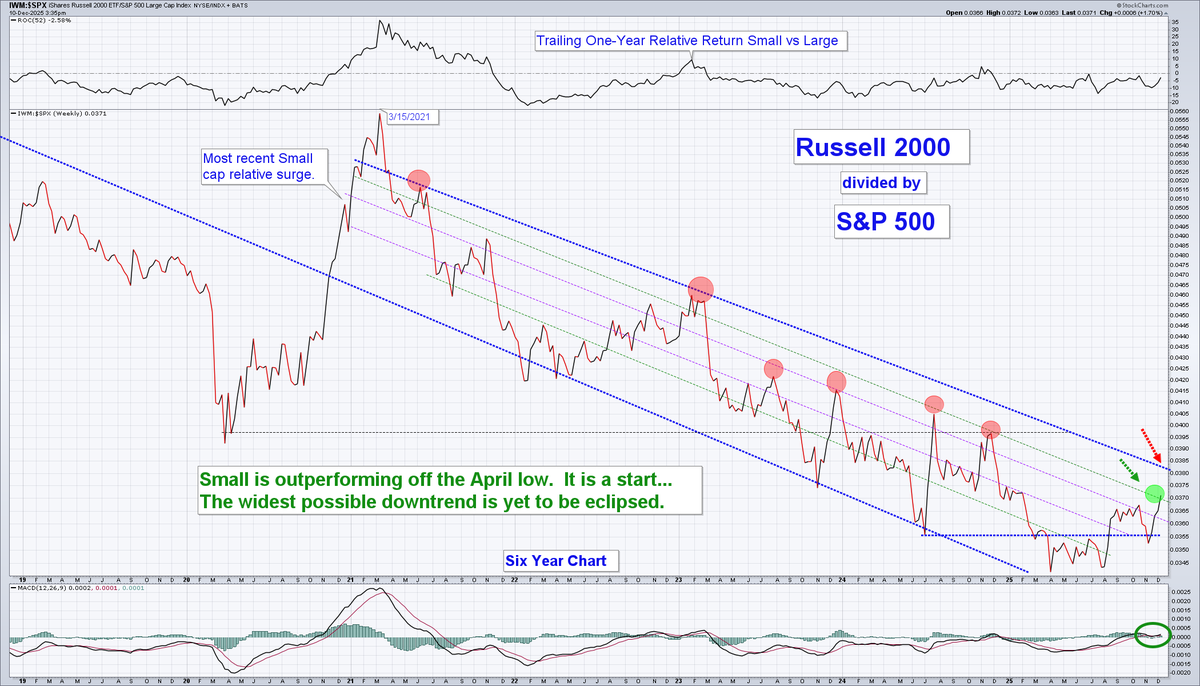
This is a potential sea-change. The average S&P 500 stock has broken its downtrend vs the S&P 500 market cap weighted index. Sign of improved breadth and good for active management and stock pickers.
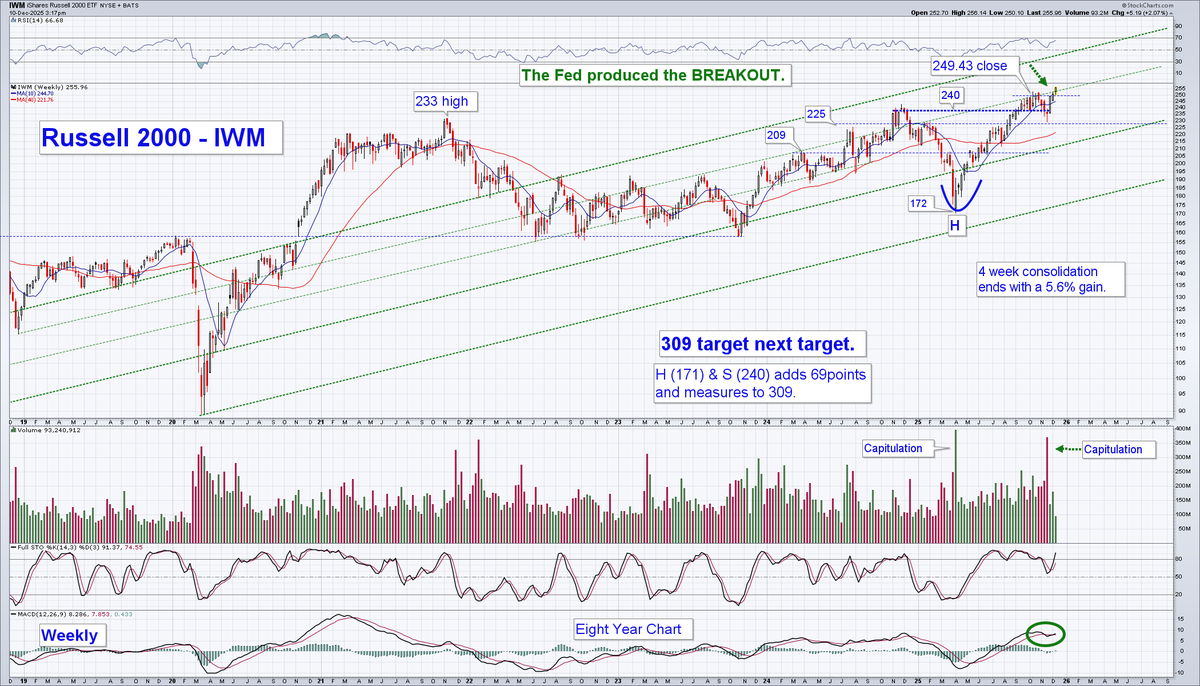
Small-caps are outperforming the S&P 500 off the April bottom. Today the IWM is eclipsing an important downtrend and only has the widest possible parallel uptrend to eclipse before one can argue that the $IWM is in a sustained uptrend.
Noteworthy that stocks are up broadly and in size, and yet MSFT, META, and NVDA are down. IWM up 1.9% and IWN up 2.4%. That is a huge difference from the last few years and signals an important change in leadership. As Jim Carey once said to Mary in Dummer and Dummer, from a small-cap relative leadership position, "So you are telling me I have a chance?"
Small-caps $IWM breaking out on the "Not QE, QE" coming sooner and bigger than expected, the rate cut, and the insight that job growth has been on average negative 20k per month the last three months due to measurement errors. IWM and stocks strong into year end.
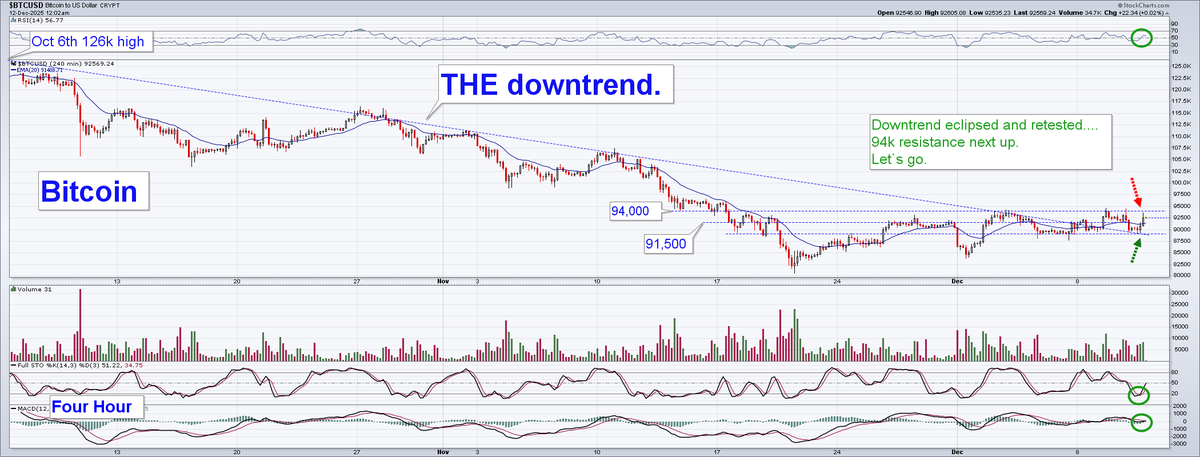
BTC uptrend now appears to be in place. Why? Powell finally EXPLICITLY admitted that the Fed thinks the actual job growth is negative 20k per month once correcting for measurement errors. He tried to hide that fact. I question why he did not say this clearly the first time when he was squirely.
This admission of job declines released BTC to move higher and out of the sideways price action and convincingly eclipse the October downtrend.
Bottom line, the Fed provided the "QE, not QE" sooner than the Street thought, and the labor market is weakening visibly. BTC should go nicely higher.
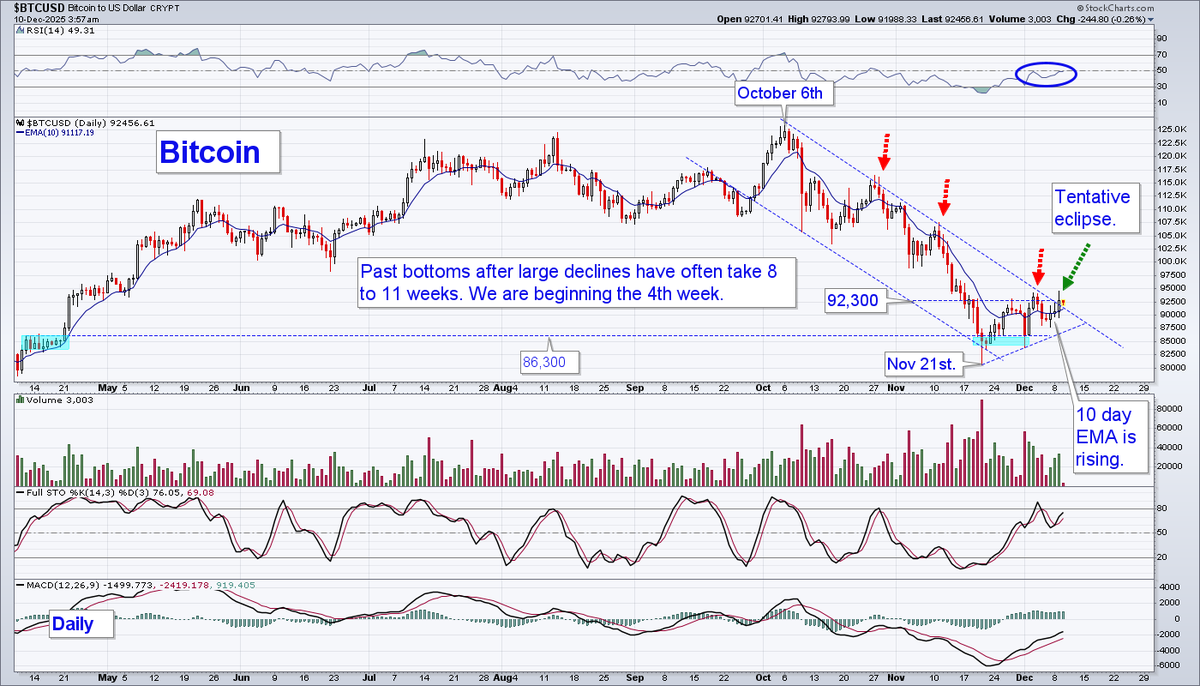
This daily $BTC charts the drama surrounding $92,300 resistance and its tentative eclipse of it and the Oct downtrend. Tomorrow's Fed meeting will catapult BTC higher or lower & reinforce the trend. It is unlikely to promote a neutral reaction. My vote? Breaks higher. The trend is now higher.
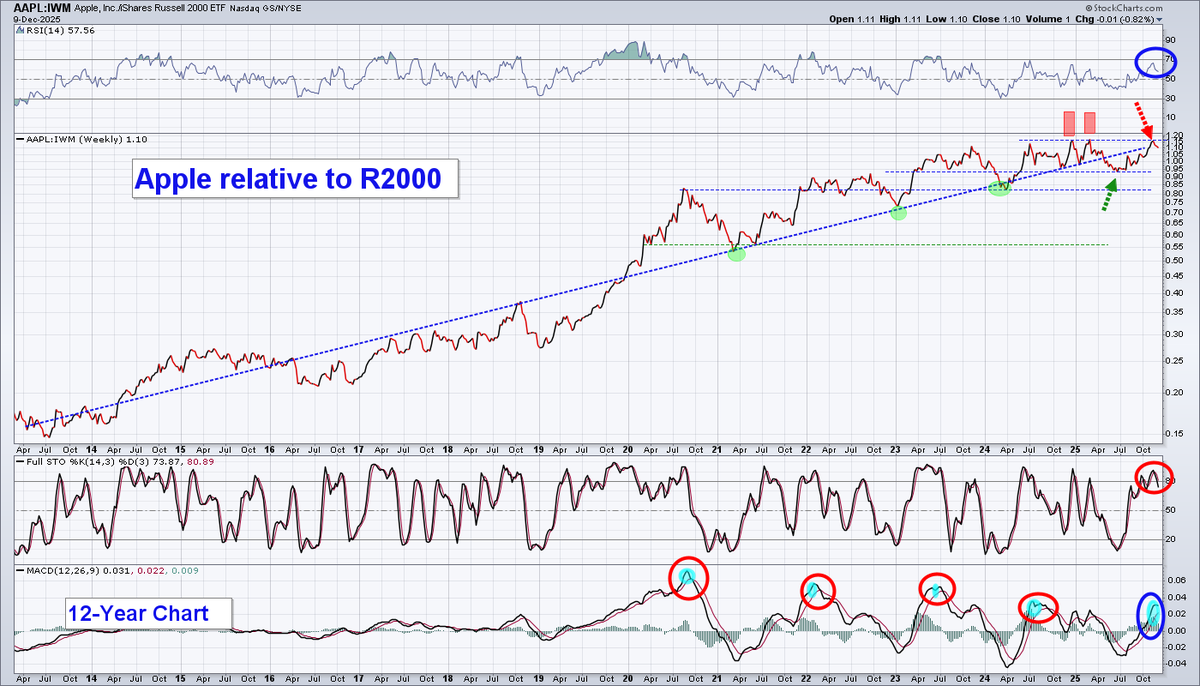
$AAPL posted a bearish Shooting Star last week at its long-term uptrend's leading edge, while failing for the third time to eclipse relative resistance vs the $IWM, which is seen to be the weakest relative index to be judged against. If small-caps are going to outperform, Mega-caps like AAPL will need to struggle.
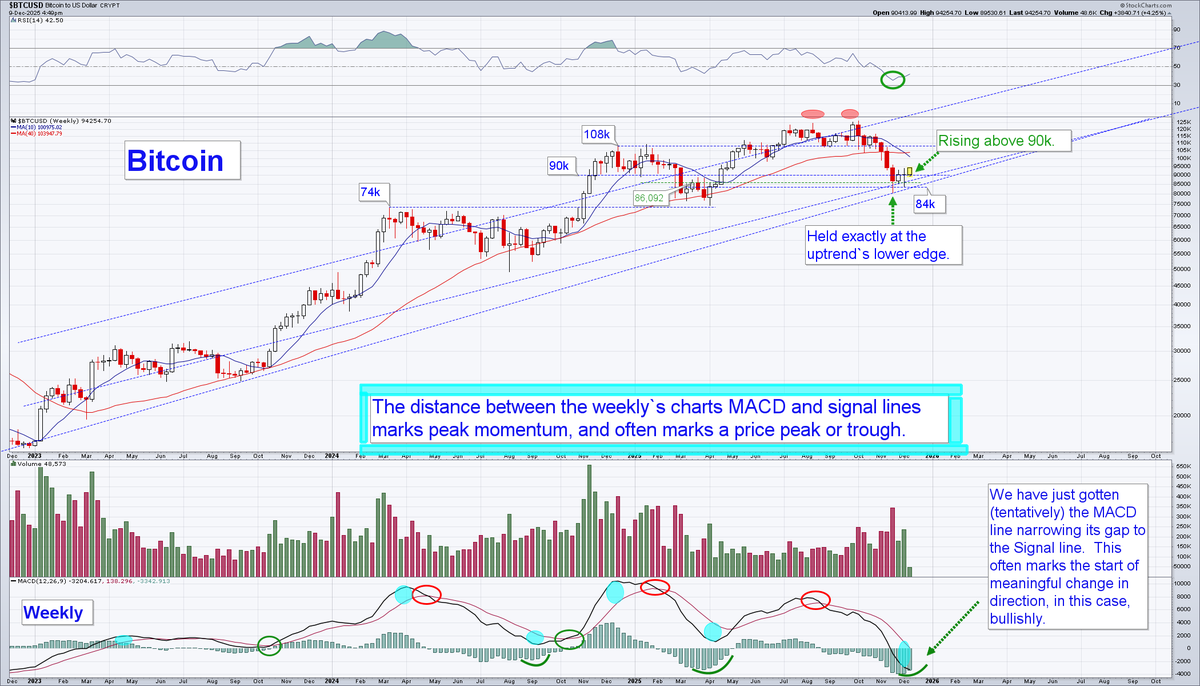
BTC just issued the weekly MACD signal I have been waiting for, suggesting a bottom is in. The large distance between the MACD and Signal lines on the weekly chart has just started to narrow from its extreme. Narrowing in the MACD and Signal lines often marks the start of a change in direction, which in this case would be bullish. Here are weekly & daily BTC charts. Note the daily shows BTC still in the downtrend.