#ArcGIS Maps SDK for #JavaScript v4.27 released! It brings related record editing, scene layer editing, 3D basemaps, #real-time stream layer authoring & saving, new widgets and lots more. Check out the release highlights here https://t.co/1JtpleWENG
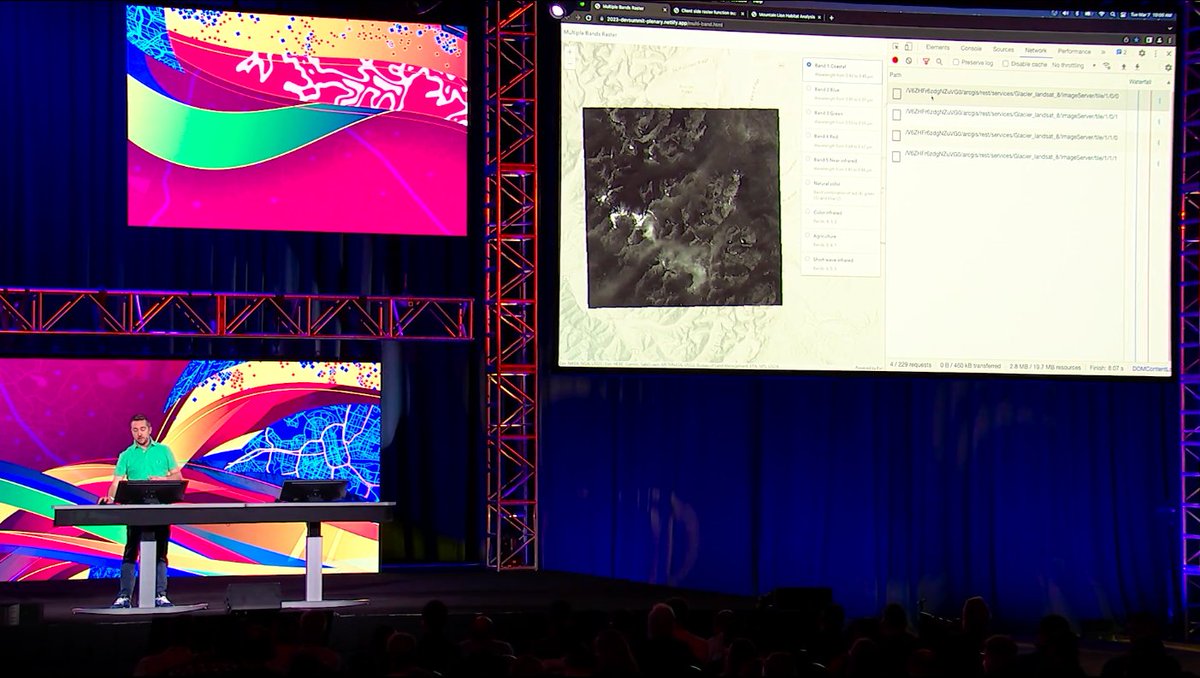
Processing raster data directly in the browser, using CPU and GPU opens lots of new opportunities for interactive analysis.
That was great going back on the big stage after 4 years to present the team's work!
The demos are here https://t.co/ViLIqIfXmj
Mark your calendar! 🗓 The #ArcGIS Maps SDK for #JavaScript product team will host a livestream on Tuesday, April 11th at 9 am PST to discuss the latest features in the 4.26 release. We hope to see you there! https://t.co/iDLKaklH8L
Are you using the #ArcGIS Maps SDK for #JavaScript in a virtual environment, e.g. VDI or VM? Be sure to check out this blog post for the latest insights: https://t.co/B80IFnIoBu
#DevSummit#esrijs
#ArcGIS Maps SDK for #JavaScript’s first release of 2023 is out! It includes new functionality such as client-side raster functions, snapping while measuring in 3D, more label styles & highlight options, and many other enhancements! Learn more here: https://t.co/Pit7563N8G
While everyone is talking about #reactivity and #signals, here is a blogpost about the ArcGIS Maps SDK’s take on reactivity. Thanks to @agup and @lboyd93 for taking the draft and turning it into a real post!
https://t.co/RQ7e8E0uE4
#esrijs#gis#esri#arcgis#mapssdk
Mark your calendar! 🗓 The ArcGIS API for JavaScript product team will host a Livestream on Tuesday, November 29th at 9 am PST to talk about the latest features in the 4.25 release. Hope to see you there!
https://t.co/XUaDJr6AJV
Starting in December, we will begin delivering our client SDKs and APIs under one name, as ArcGIS Maps SDKs. Find out more at https://t.co/UJRj2kQGI3 #ArcGIS#JavaScript#ArcGISRuntime#ArcGISMapsSDKs
#ArcGIS API for #JavaScript (v4.25) was released! New features include related records in popups, custom cluster styles (like this image showing clusters of 311 calls in NYC as pie charts), dimension layers in 3D, and more! Get the scoop: https://t.co/iQ1a1beMBV
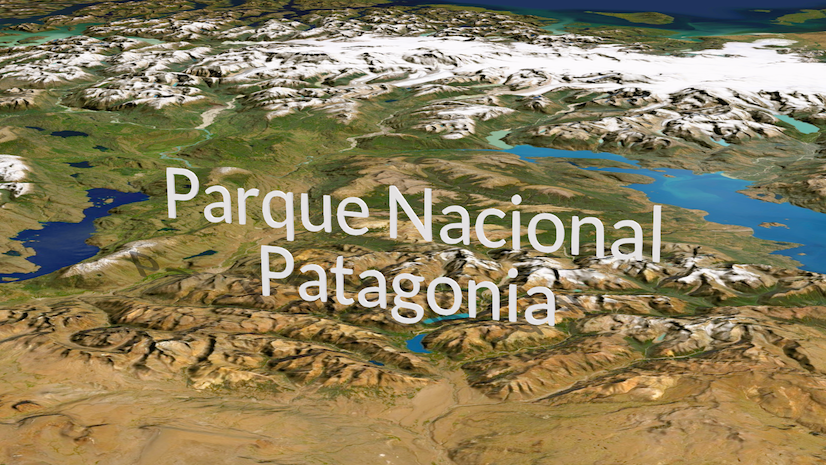
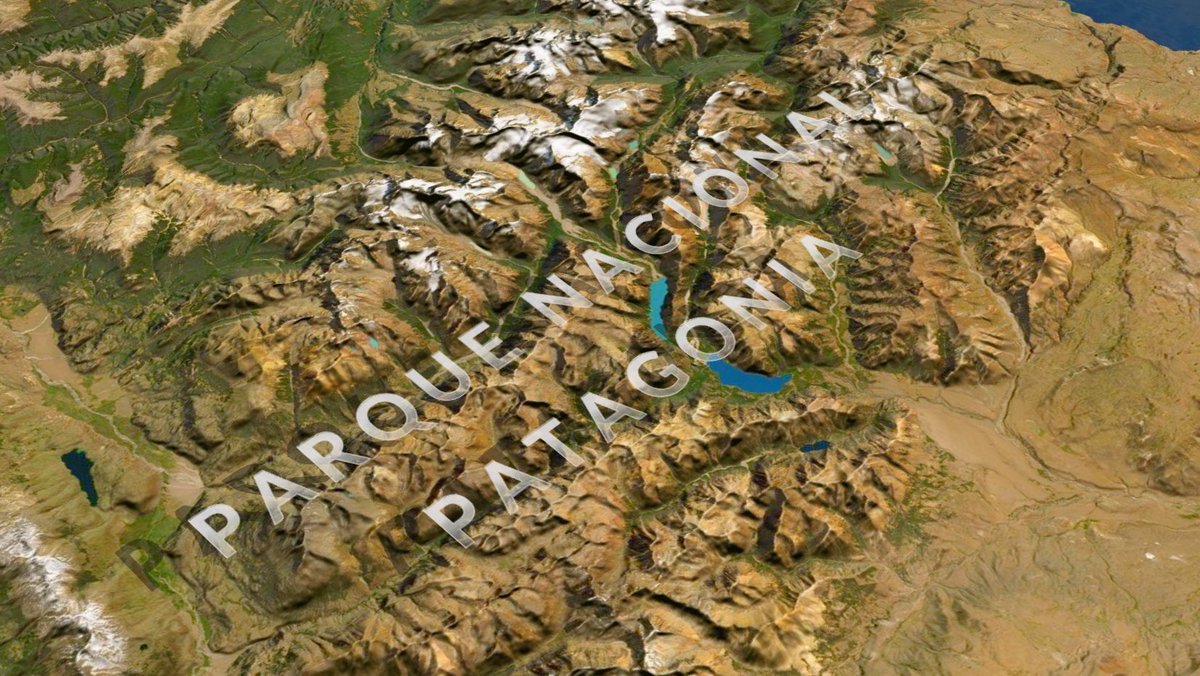
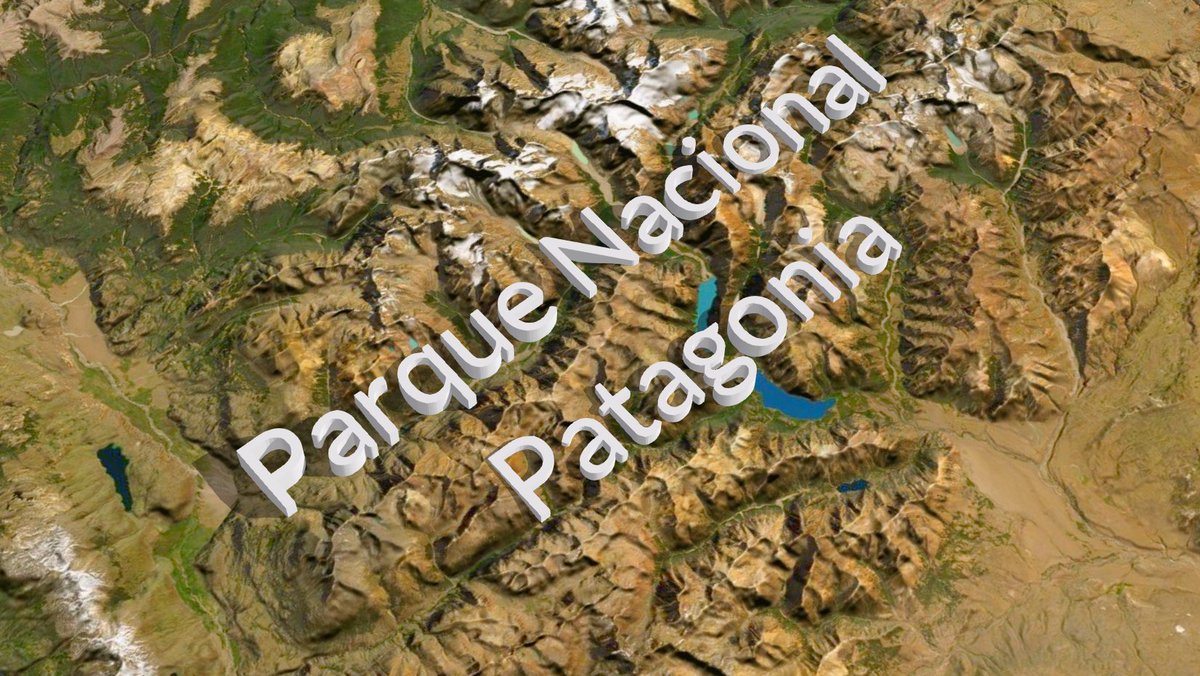
I played around with labels in 3D maps. Curious if you would use it or if you know examples of maps where such labels are used. #cartography#3D
You can play with the interactive, web version here: https://t.co/QdYrO3prvW
Hurricane Tracking Map: https://t.co/Sq0By7Pdpb
An old map that comes back to threaten me every year. Built with @Esri live feeds for hurricanes and @ArcGISJSAPI
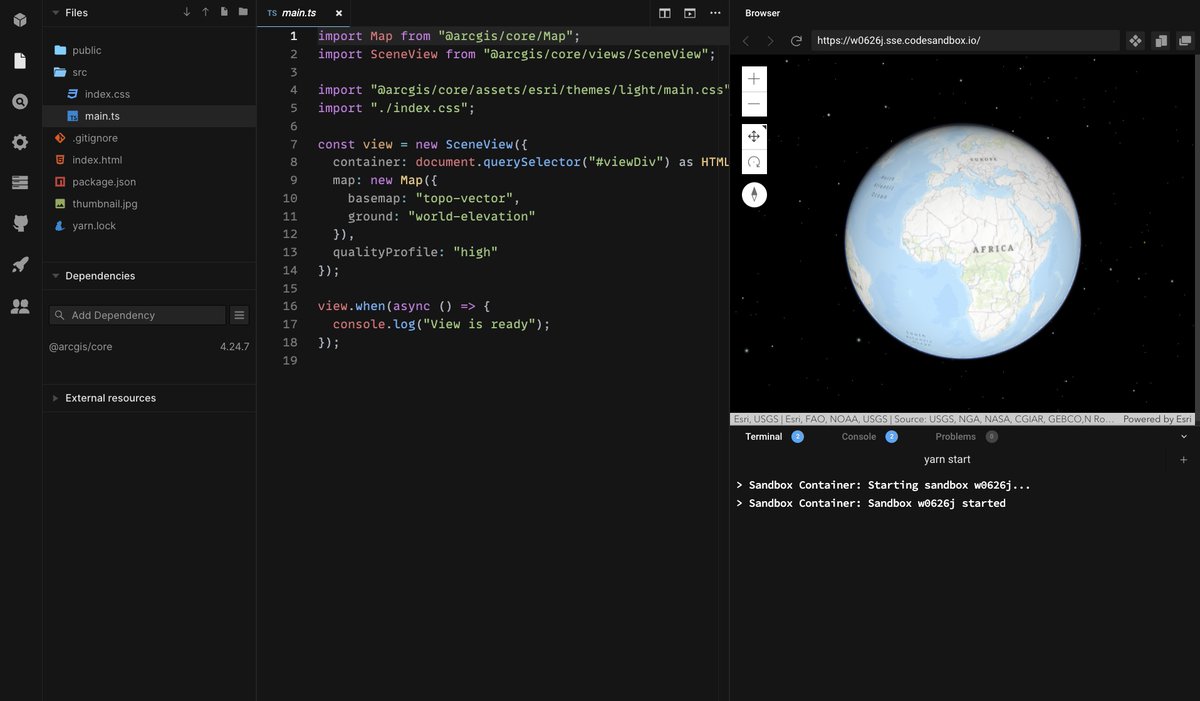
Just created a @codesandbox sample showing how to use the #ArcGIS API for Javascript (@arcgis/core module) together with @vite_js. Getting started could not be easier! Check it out here: https://t.co/60DIOQfXGP