#Bitcoin
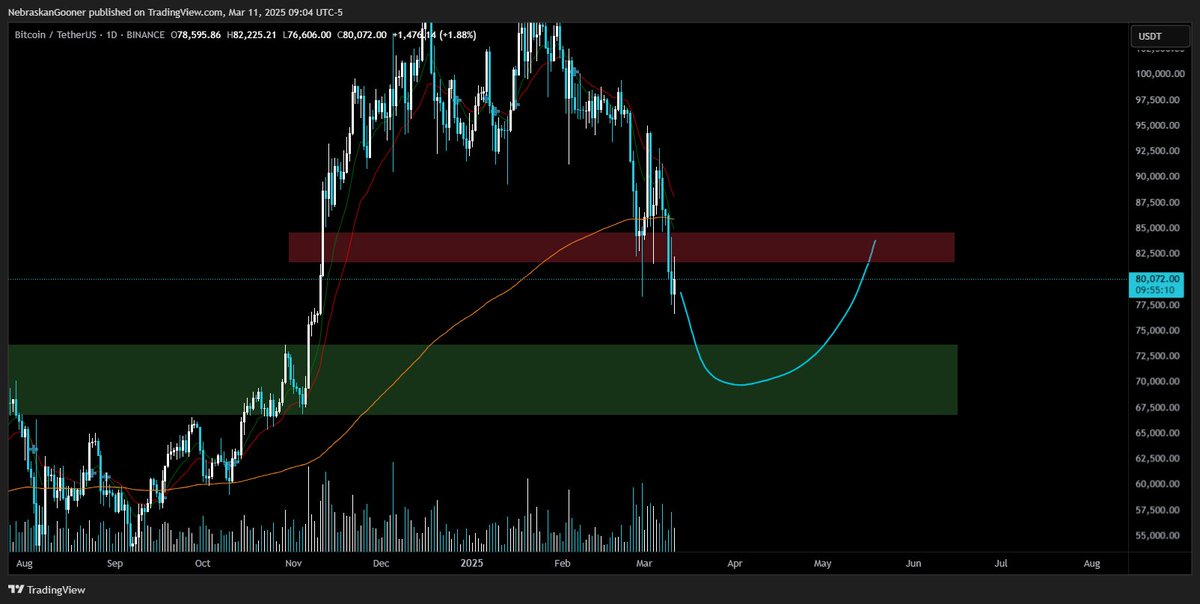
Bullish scenario triggered here with today's close.
Invalidation below today's candle base.
Two potential upside levels to look for upside targets.
Will post a weekly update as well with more info.
#Bitcoin
Currently in bear trend on daily time frame lagging behind many altcoins that are way past this early stage.
Major support is still lower..
If I had to try and predict what I think is most likely scenario to play out would look something like this.
$BTC - Currently I am leaning towards a dump to D1 FVG as we are rejecting of off monthly open/H4 OB resistance.
If price keeps consolidating tightly here and starts closing and holding above MO, I will flip long right here itself.
Will keep you updated as PA develops 🤝
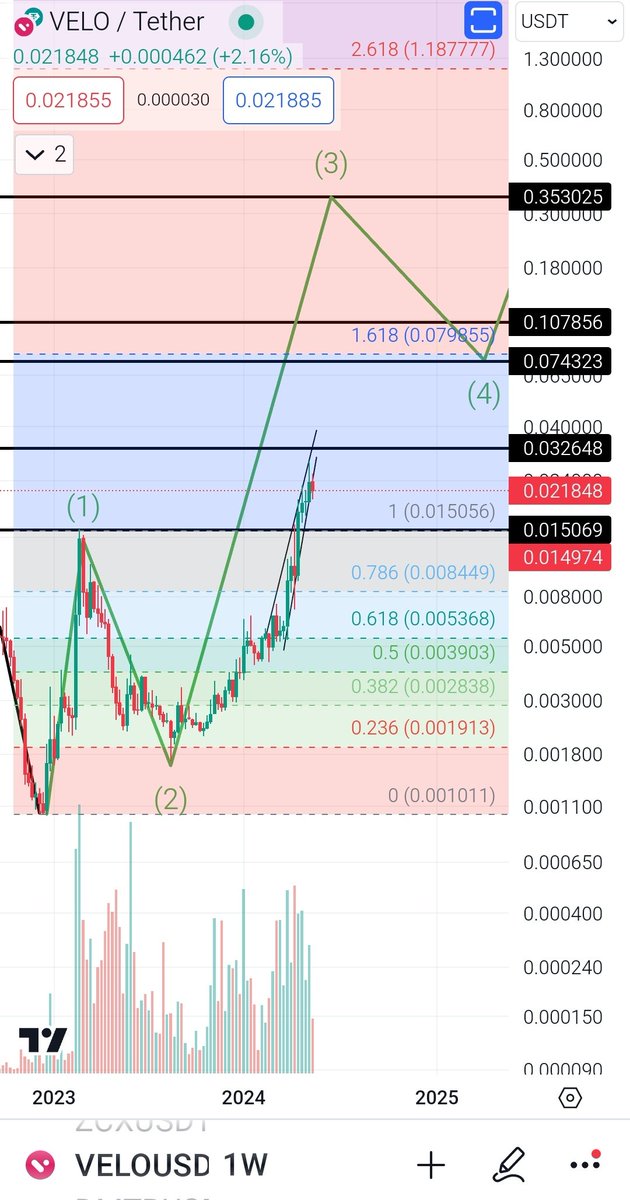
$velo #velo $0.07 is min. target of wave3 which will be achieved in any case
I have been telling all this when we were 5x lower, ROI is decreasing day by day (I cant account for the situation where it goes 1000000x in fomo like matic, those are just extraordinary sitations)
Let's say hypothetically you walk away with 5M USD free and clear post taxes end of this cycle.
How do you allocate that money so you can flip it into 100M? (Assume you are ~25 years old)
Bonus points for pathways that include trading, investing, and cash flowing businesses.
@veloprotocol using 2 different Fibs we get a range between .04 cents and .10 cents as full ext targets for $velo to complete a Wave 3. The Fib on the left is a Trend Based Fib Ext. Using the complete height of what I would consider wave 1 in the green oval we can determine the average height of wave 3 to be 1.618 of wave 1 which would take us to about .04 cents. The complete Ext would take us to .10 cents. There are higher levels than the 4.236. So don't think .10 cents is the very top. Its an average full ext.
The Fib on the right is taken from the top of what I would consider wave 1 in the green oval and the bottom of the retracement which would be the orange circle and that gives us a full ext of about .06 cents.
The blue fractal in between the fibs is a shrunken down version of the green oval. you can see that we are starting to form a similar pattern. will it continue the same pattern? I have no idea. We are riding this thing up and every time I have a handle on things the algorithm changes things. My targets are somewhere in the yellow rectangle.
This is my tentative idea of what I think is going on. Not financial advice. I'm just a dude on the internet sharing my thoughts on what I see. I'm always open to suggestions and tips. I would like to be right about things I understand, but I understand that I don't understand everything, and also have the potential to not be right about what I think I understand sometimes.🤣
How many times have I begged you day and night to buy all in Crypto right after FTx crash, telling you that 16-18k is a great region to buy. How many of you remember?
Now #Bitcoin is up x4 above my first entry and I see no reason to sell here. Going to wait for my 180k target
Altcoins - Huge rallye loading ⏳
Read to understand!
Historic fact: The significance of the EMA50 (50-day Exponential Moving Average), represented by the green line, is unmistakably the mother of market status of altcoins as either bullish or bearish. During the 2021 bull market, it took a span of 47 weeks before the first huge correction occurred, dumping the entire altcoin market beneath this critical green line. As you can see, altcoins reclaimed its position above the EMA50 in June 2021, propelling it towards new all-time highs (ATH).
Now in the current bull cycle a similar pattern appears. Altcoins following the mother of EMA50 with absolute perfection. Remember it took 47 weeks in last bull for the big correction, this time we have only seen 24 weeks of bull movement. Expect much higher, really much higher targets for altcoins in the coming months!
This is just one of many reasons why Altcoins will remain in bullish continuation for a long time.
Join free Telegram: https://t.co/zkdgaR6H3c
Hopefully you saw my latest Tweet
Increased my expected #Bitcoin target for mid 2025 to 170-180k. Halving starts in two weeks, super cycle loading
Do you to understand how bullish Iam?
my bullrun plan:
🔸all in now
🔸moon until apr / halving
🔸sell alts in may and run away
🔸all in again late aug
🔸blowofftop Nov '24
🔸sell while u can
🔸happy wagmi
🔸💤3 years
🔸🔂
AMA
memecoin mania + bitcoin all time highs while most altbtc pairs get hit -> profit taking into alt leaders [SOL + others] -> SOL ATHs + more solana eco tokens + new dApps releasing -> new L1 launches [Bera / Anoma / Sovereign] -> consolidation of majors -> ETH + 4844 szn -> Monad
I have zero clue why anyone hasn’t seen this yet . If @blknoiz06 is calling SEI the $SOL of cosmos , y’all should pay attention.Kyle truly is running back the Solana play with Sei this cycle. DragonBall Z chain = gud chain
This is before the eco fund announcement as well
$SEI likely has one more parabola pump to go super SEIYAN before a decent pullback.
Should that pullback happen, it’s the motherload dip before teleporting to Planet Namek
Bet Often. Bet Big . Bet Early.
BET MORE
My Prediction:
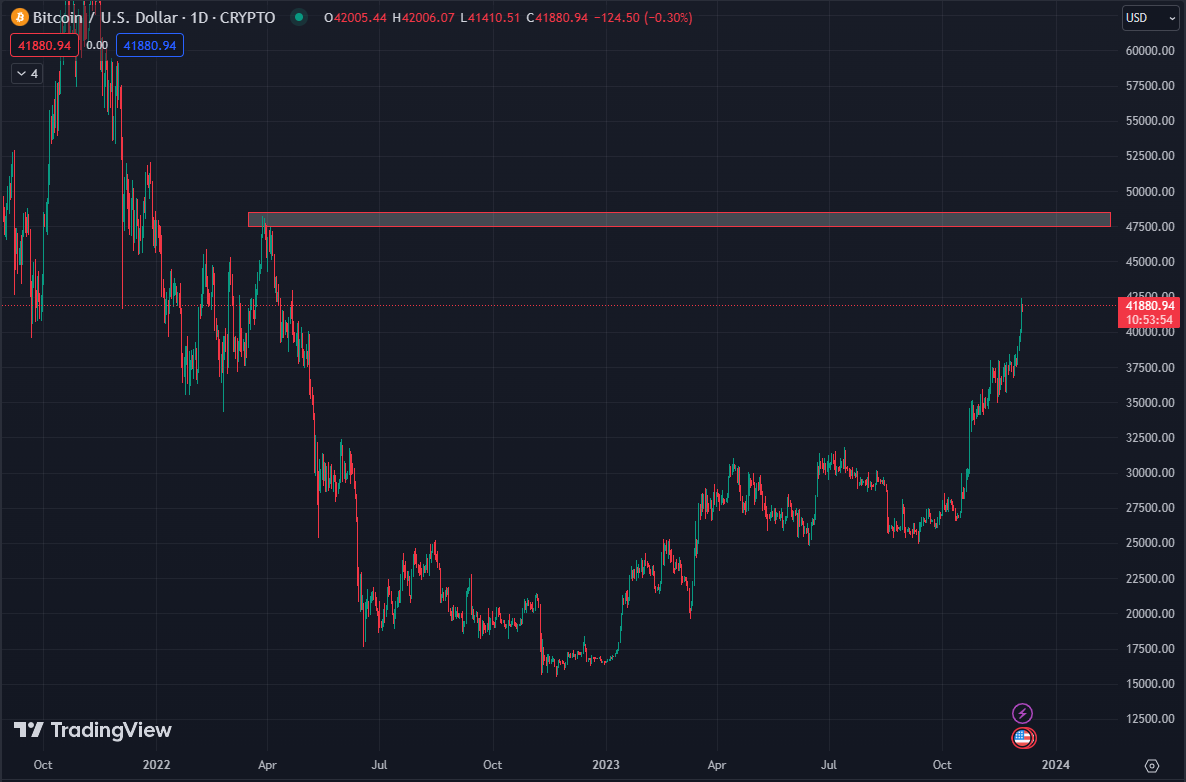
> $BTC runs to around 48k
> normie interest triggered
> normies sign onto $COIN & go to their last cycle coins of choice, primarily $DOGE
> ALTs all move up in unison
> $BTC tops out first then alts
> $DOGE keeps running
> ''dog to frog'' rotation happens
> $PEPE is last coin running, maybe $BITCOIN too
> $PEPE topping out marks the cycles locals top
> ≥15% correction for $BTC, ≥25% for alts
> late levered longs revenge trade the correction all the way down, lots of liquidations
> local bottom likely marked when the perp dex degens flip short and funding goes negative