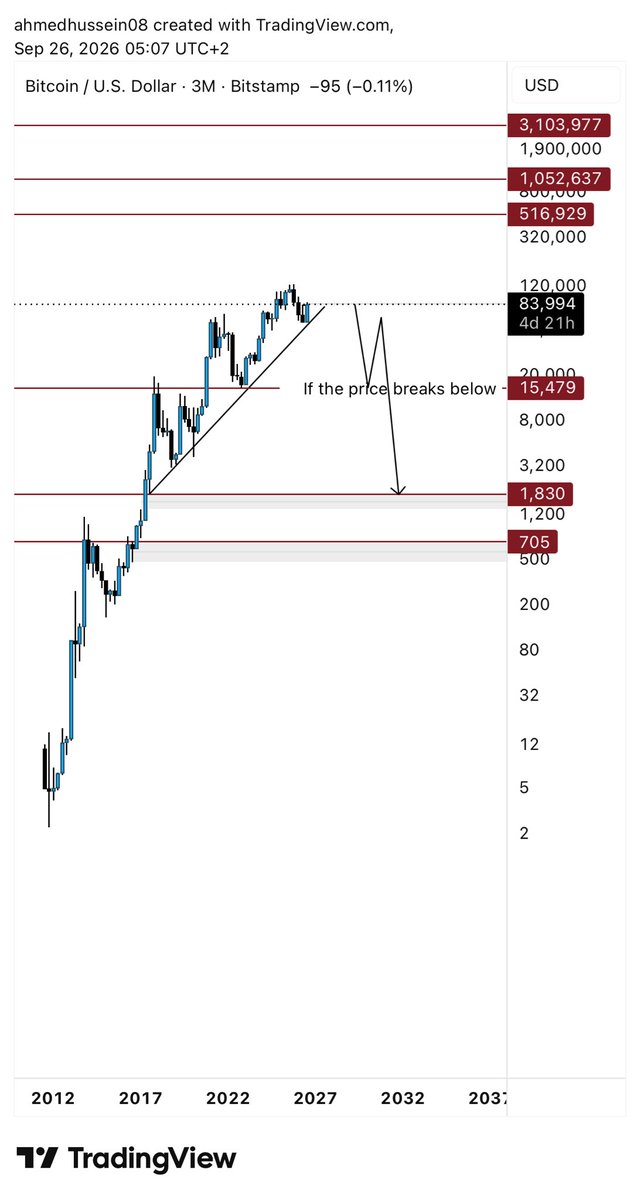
As you can see, Bitcoin has been trading within a long-term ascending channel since 2017, forming higher highs (HH) and higher lows (HL).
The price began its upward move near $1,900, forming a five-wave bullish structure with a target of $126,000.
Given the current conditions, including rising inflation, increasing oil prices, potential interest rate hikes by the US Federal Reserve, and the war between the United States and Iran, it will be extremely difficult for Bitcoin to successfully establish a new all-time high.
On the monthly timeframe, there is also a bearish divergence: price is forming a higher high (HH), while the RSI is forming a lower high (LH).
Furthermore, the market structure on the weekly timeframe has shifted from bullish to bearish. Sellers are currently in control, and this directional shift has only recently occurred.
A Head and Shoulders pattern has also formed, further supporting the bearish outlook.
Therefore, in my view, a weekly close above $98,000 or sustained daily price action above $98,000 is highly unlikely. Given the aforementioned conditions, a new high above $126,000 seems virtually impossible.
The key condition is for Bitcoin to close below $14,000 on the weekly timeframe or establish sustained daily price action below $14,000.
If this happens, we will enter a new phase of decline, as the market structure will change on both the monthly and quarterly timeframes. The overall trend will shift completely.
Based on my analysis, Bitcoin is currently preparing for a deep price correction.
I believe the price could fall toward the $1,000–$450 range.
If Bitcoin reaches this level and manages to regain public trust and confidence, successfully beginning another upward move, it could rise from the $1,000–$450 region toward targets of $500,000 to $3 million.
#btc #trump #iran #inflation #usd
As you can see on the chart, gold has been in a long-term uptrend since 1973.
In 1980, gold fell by 71% due to the Federal Reserve aggressively raising interest rates to combat inflation. US interest rates reached nearly 20%.
After 20 years of struggle, gold recovered and entered a new phase of growth.
Interestingly, gold stopped declining when it reached a 70% correction of the bullish wave that started from around $100 per ounce. Gold then rose from approximately $250 in 1999 to $1,920 in 2011, gaining 661% after its 71% decline.
In 2013, gold fell sharply amid expectations that the Federal Reserve would taper its bond-buying program, leading to outflows from gold ETFs.
Interestingly, gold stopped declining when it reached the 50% retracement level measured from the major low.
Gold then stopped falling and rose from 2015 to 2020, gaining approximately 98% after its 45% decline.
From 2020 until the end of 2023, gold moved sideways. After that, prices began a powerful rally, reaching $5,598.
Now, we are facing a global crisis.
The war between the United States and Iran is driving oil prices higher, which fuels inflation. As a result, the Federal Reserve may need to raise interest rates, putting downward pressure on gold.
Technically, the US Dollar Index is trending upward toward 107, while 10-year Treasury yields are heading toward 8–10%.
All these factors could be enough to trigger a 76% decline in gold, targeting major support around $1,300 per ounce.
Even if gold does not fall that far, I believe it will eventually decline toward $2,762, followed by another target at $2,200.
If gold reaches the projected bottom at $1,300, my expectation is that it will then begin a major rally toward $10,000 per ounce.
After several years of accumulation or correction, prices could eventually head toward $36,000–$60,000 per ounce.
This process could take 20–30 years, but I believe it will happen.
#gold #USA #Trump #Inflation #United States 10 Year Government
@Abo_Malllak اي ترجع للنفط ! اصلا نزل بس ٢$ من السعر و رجع ارتفع مرة ثانيه ! انا كنت شاهد على اللحظة وقت نزل السعر دخلت فوركس فاكتوري اشوف شنو صاير ترامب يجدب هو بس يدخل صفقات و يطلع بتصريح يربح و يطلع 👍
@withmonis انت فاهم الموضوع غلط يا حبيبي Long Liquidation liquidity هو مصطلح للصفقات الشرائية و حاطين ال Sl تحت احد القيعان او مستوي سعري ! ليش لانه السعر ان كسر المستوي هذا ف السعر ما رح يتوقف ! ف لذلك المشتري لا يريد انه السعر يعكس عليه و ارباحه الغير محققه تروح على الفاضي !
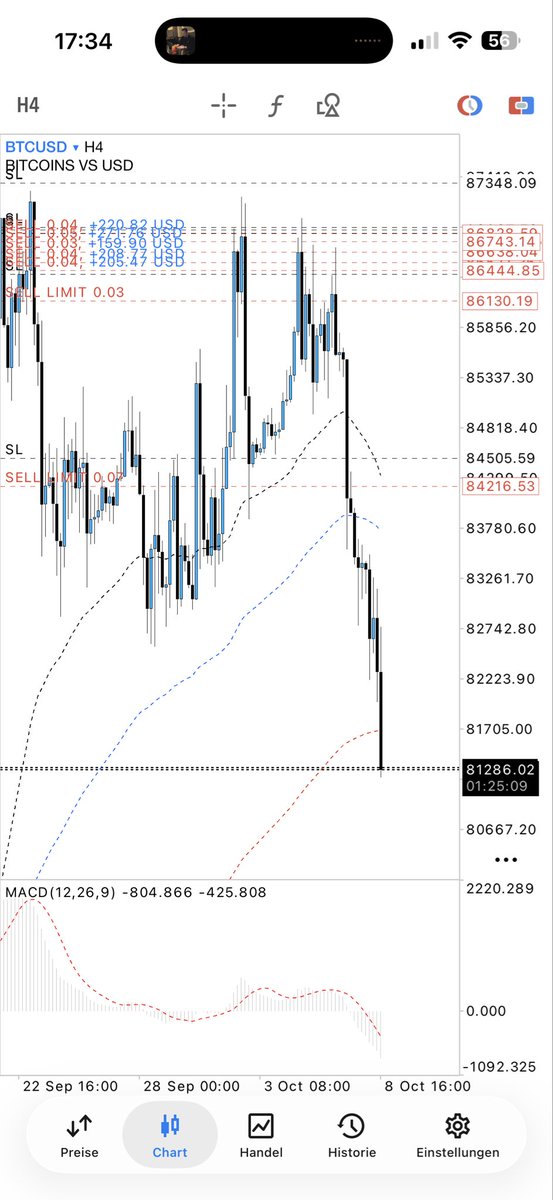
@CryptoCycleKing استمتع 😂😂 الهدف 32K و اذا ما جابها حرااام علييي اذا اتداول البتكوين 👍👍 وشكد ما ارتفع رح ابيع و بشرط ما يغلق فوق ٩٨ الف ف اجباري رح ينزل ٣٢ الف . للعلم على حسابي الثاني داخل ٤ صفقات اخرى ايضا بيع من نفس القمة
@oufa28 برافو، هذا هو وجهة نظري ايضا للعلم صرلي ٦٥ يوم بايع داو جونز محقق 111RR وهدفي 278RR . و الحركة يلي تشوفها هي نفسها موجودة على الناسداك و نفسها على الداو ! اشوف انه اسعار النفط متجها الي ١٤٥$ ومممكن حتى ١٧٠$ وعوائد السندات انا درست تاريخه بظبظ كل حركاته و اشوف حاليا صاعد ٩،٨٪