S&P 500 firms with highest relative volume over trailing 5-day period when compared to trailing 10-day, along with corresponding performance. Apparently, Fin Tech industry is frequent. $GPN leads the grouping #Industrials#FinTech#sp500
Measuring returns between MAGA stocks over prior 3-month period. Apple $AAPL first at -8.6%. S&P 500 Index $SPX: -11.7% Microsoft $MSFT: -16.1% Alphabet (Google) $GOOG: -21.2%. Amazon $AMZN bottom at -23.1%. #BigTech#technology#maga#stocks
#Bearish Unusual levels seen for $CCL in performance : 100-d Perf., Streak Return, 50-d Perf. & technicals : % off 100d SMA. Similar prior instances found by AI led to a median of -31.0% over next 200 days; performance was down 77% of time #sp500#ConsumerDiscretionary#Leisure
Uncommon #Bearish#Seasonality Pattern for $HII Huntington Ingalls Industries, Inc. shows that prior May performance (historical calendar month) has a median of -2.8% and is down 72% of the time #sp500#Industrials#Aerospace#Defense
S&P 500 companies nearest to their trailing 100-day period low along with corresponding overall performance for period. Looks like Food industry appears often. $ENPH tops this collection #ConsumerStaples#Food#sp500
#Bearish Unusual levels seen for $MO in performance : 200-d Perf. & technicals : Chaikin A/D, OBV & volume : 50-d Rel. Vol.. Similar prior instances seen by AI -- median of -2.5% over next 200 days; performance was down 59% of time #stocks#ConsumerStaples#MiscConsumables
S&P 500 companies most below their trailing 10-day exponential moving average along with corresponding overall performance for period. Clearly, Care & Services industry appears often. $UNH tops the group #HealthCare#Care#Services#sp500
Analyzing performance between value by cap size over 2-year period. S&P 500 $SPY tops at 24.8%. Large Cap Value $VTV: 13.2% Broad Value $IWD: 12.2% Mid Cap Value $VOE: 10.4%. Small Cap Value $VBR bottom at 7.5%. #capitalization#value
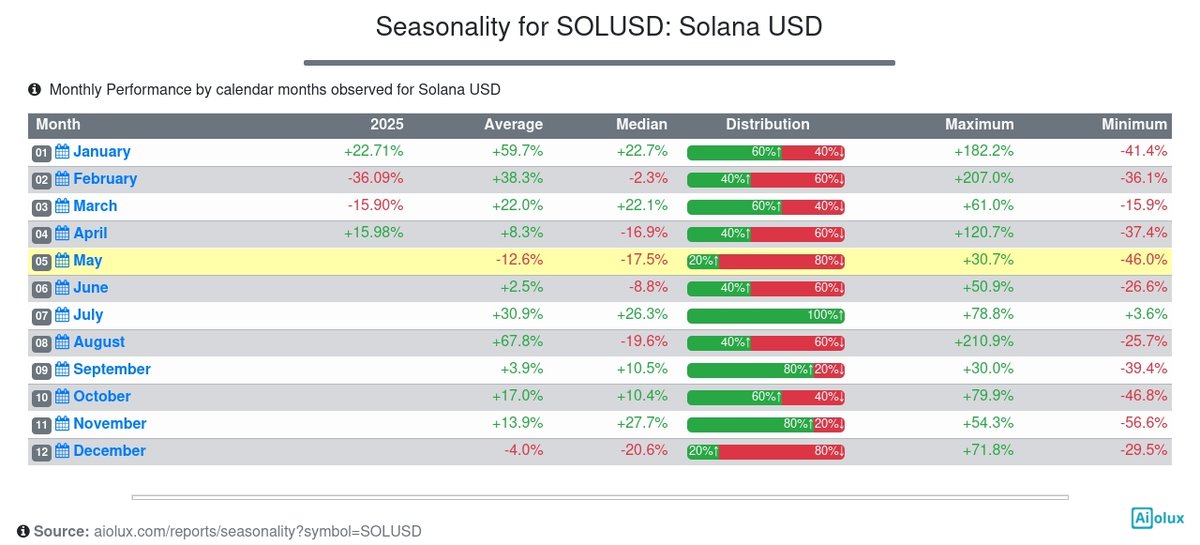
Atypical #Bearish#Seasonality Pattern for $SOLUSD Solana USD shows that prior May performance (historical calendar month) has a median of -17.5% and is down 80% of the time #crypto
#Bullish Unusual levels seen for $IPG in performance : 100-d Perf., 50-d Perf. & volume : 100-d Rel. Vol. & technicals : % off 200d SMA. Similar prior instances found by AI -- median of +15.2% over next 200 days; performance was up 93% of time #sp500#CommunicationServices
S&P 500 stocks furthest from their trailing 100-day period high along with corresponding overall performance for period. Clearly, Semiconductors industry features most often. $TSCO leads this group #ConsumerDiscretionary#Semiconductors#sp500
Contrasting returns between energy themes over last 2-week period. Clean $ICLN first at 3.4%. Oil Services $OIH: 2.5% Infrastructure $EMLP: 1.9% Exploration & Production $XOP: 1.7% Energy $XLE: 0.8%. Solar $TAN last at -4.4%. #energy#CleanEnergy#Oil
Unusual #Bearish#Seasonality Pattern for $ATOMUSD Cosmos USD shows that prior May performance (historical calendar month) has a median of -3.9% and is down 84% of the time #crypto
#Bullish Unusual levels seen for $MMC in technicals : RSI & performance : 200-d Perf., Streak (days), 100-d Perf.. Similar prior instances shown by AI led to a median of +17.6% over next 200 days; performance was up 97% of time #sp500#Financials#Insurance#anomalies#backtest
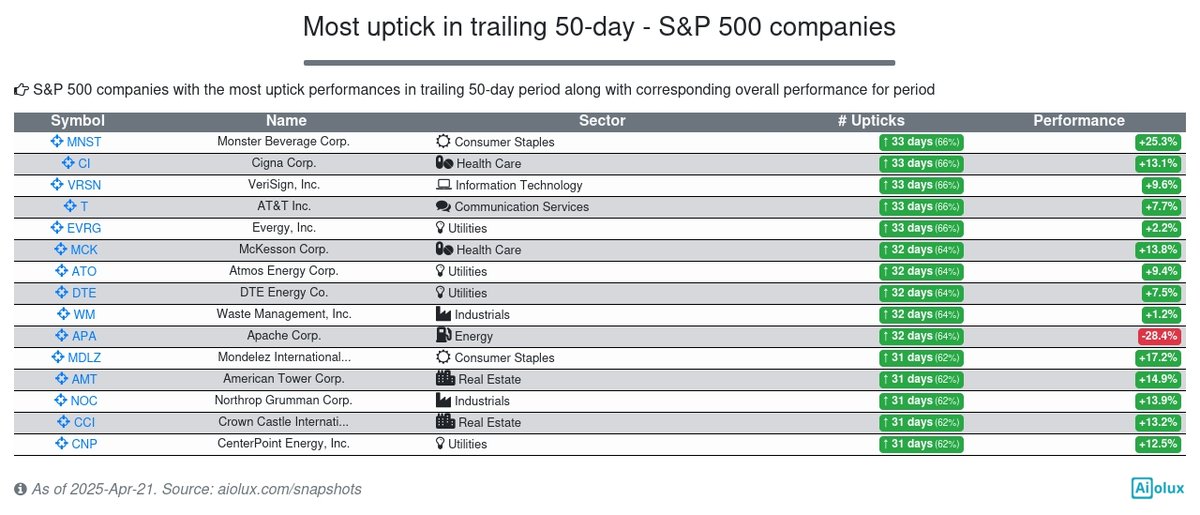
S&P 500 stocks with the most uptick performances in trailing 50-day period along with corresponding overall performance for period. Interestingly, Electric Utilities industry features prominently. $MNST heads the group #Utilities#ElectricUtilities#sp500
S&P 500 companies with the most uptick performances in trailing 50-day period along with corresponding overall performance for period. Looks like Electric Utilities industry is frequent. $MNST leads the list #Utilities#ElectricUtilities#sp500