Digital asset based community! Options trading, crypto, financial investments, and freedom. Hop on our Discord to peep more!
Tweets induce concepts, not advice.
Even in a bear market with much volatility we are catching plays, and building our ports at All In Trading Group. Don’t sleep, just because crypto has taken a mainstream hit doesn’t mean YOU have to. Our FREE GA Discord is always available in our bio 🫣 Big things on the way 🔜
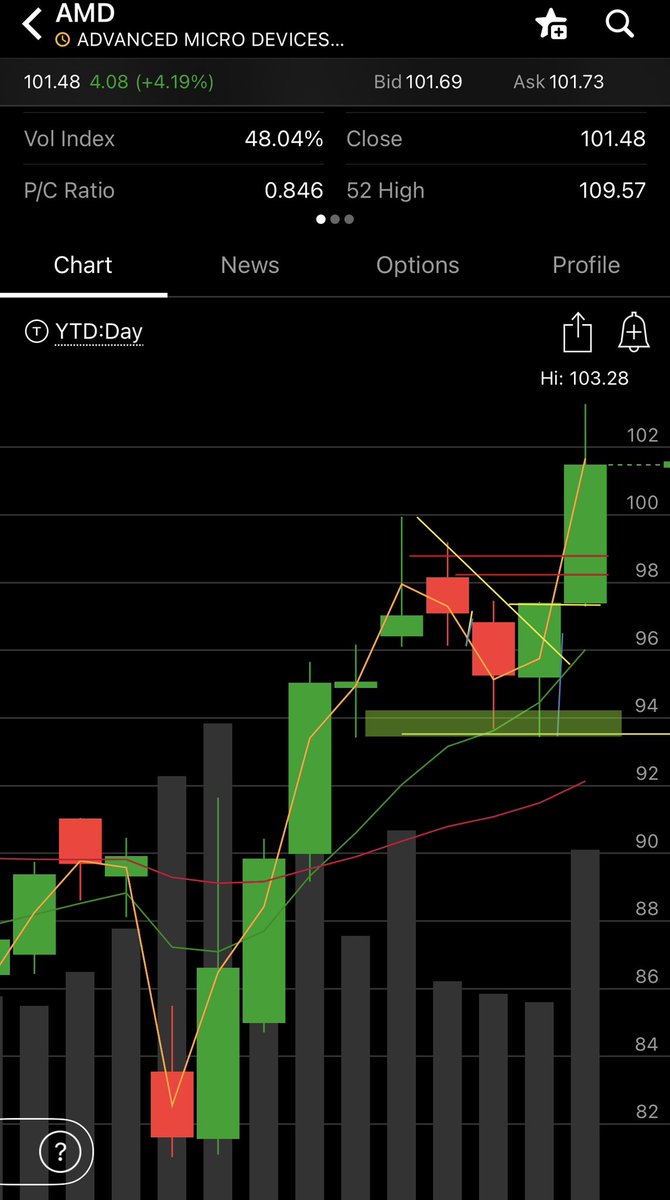
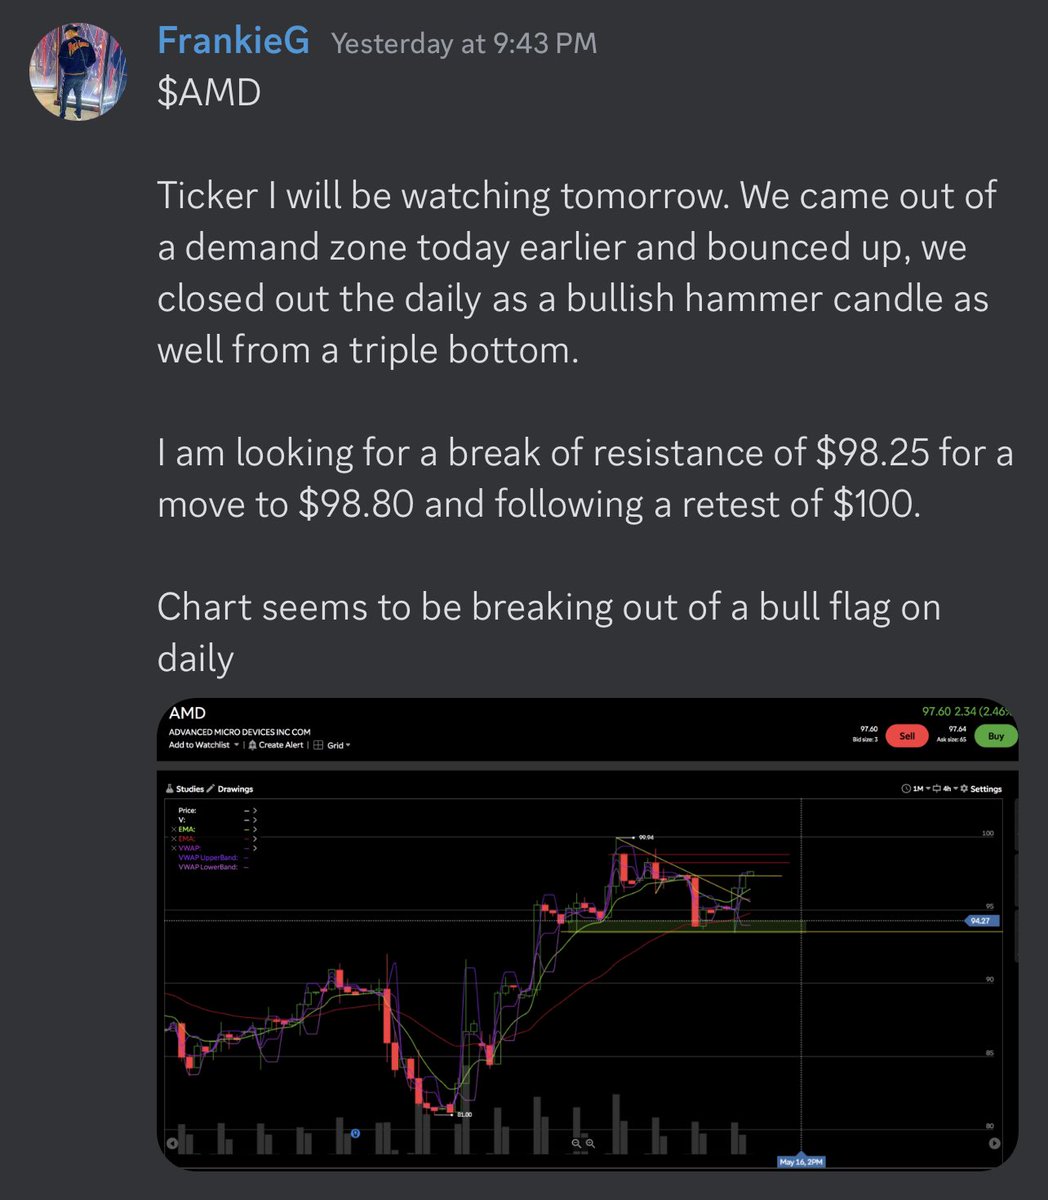
$AMD Was an absolute BANGER hit today and called out yesterday as a top watch after a bullish set up played out on the daily!
Triple bottom hammer candle off a trend line? = Boom!💥
Calls ran 500%
$AMD Was an absolute BANGER hit today and called out yesterday as a top watch after a bullish set up played out on the daily!
Triple bottom hammer candle off a trend line? = Boom!💥
Calls ran 500%
$SPY Bearish Scenario 📉: To get more bearish we need to break down below $411, $407 and then $404.
Below $404 we will be looking for a retest of the 200 daily moving average and close that gap close at $396.
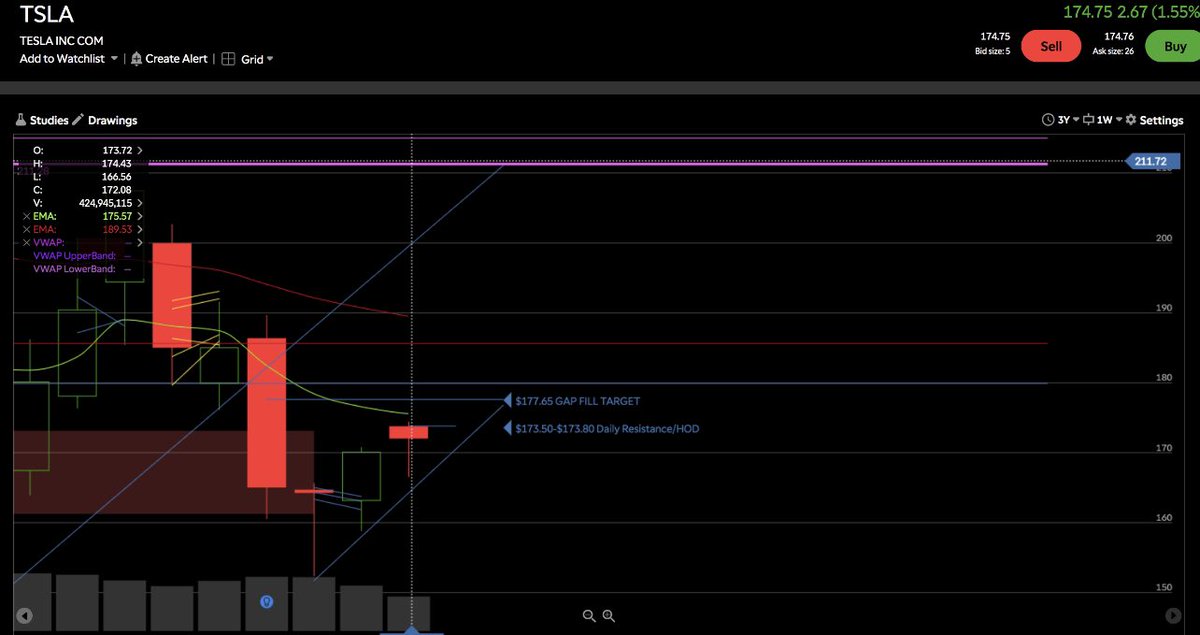
$TSLA Now to the first image/chart I am interested in the weekly candle on TSLA as well as it appears to be a doji on a trend line. This shows buyers, if a doji is closed out we can see $180 within next week. Fun stuff for the $TSLA bulls
$TSLA: $TSLA lets start off with first image/chart. This is the daily chart, TSLA has had a catalyst in news over new CEO for Twitter. Investors of TSLA prefer Elon's main focus to remain in TSLA undividedly.
In terms of technicals TSLA is in a bullish uptrend defined by lower trendline. A reclaim of yesterdays HOD sends it, yet there is resistance at $173.50-$173.80. A close above this sends it, look for next potential gap fill at $177.65 🎯