Excited to announce my first, first-author paper has been published!😄
The relative influence of climatic drivers on primary production is nearly equal to that of total phosphorus in 2561 #lakes globally.
@Sharmalab@EcoFilazzola@YorkUScience
https://t.co/Ehrh1fgGHW
The "Grammar of Graphics" is a powerful concept that ggplot2 in R is built on. It breaks down the process of data visualization into layers, making it easier to customize and understand how to build effective charts.
The visualization illustrates the essential layers used to create a plot:
1️⃣ Data: The foundation, where you start by defining the dataset.
2️⃣ Aesthetics: Map variables to visual aspects like color, size, and position.
3️⃣ Geometries: Specify the type of plot you want, such as bar, line, or scatter.
4️⃣ Facets: Create subplots for different subsets of your data.
5️⃣ Statistics: Add statistical transformations, like mean lines or trend lines.
6️⃣ Coordinates: Control the plot’s coordinate system, such as flipping axes.
7️⃣ Theme: Adjust the overall appearance, like grid lines, font styles, and background.
In the code example shown, each of these layers is combined to produce the boxplot visualization. The process starts with defining the data and aesthetics, then moves through geometries, adding facets to split the data by groups, and even applying statistical transformations to highlight the mean value of each group. Finally, it configures the coordinates and finishes with a clean theme.
In a recent Statistics Globe Hub module, you will learn step by step how to work with the Grammar of Graphics in practical R programming workflows using ggplot2.
The Statistics Globe Hub is an ongoing learning program focused on practical skills in statistics, data science, AI, and programming with R and Python, with a new module released every Monday.
More info: https://t.co/NA2b7UAXJ4
#rstats #datascience #statistics #ggplot2 #datavisualization #statisticsglobehub
You can now ask Gemini to create Docs, Sheets, Slides, PDFs, and more directly in your chat. No more copying, pasting, or reformatting, just prompt and download.
Available globally for all @GeminiApp users.
New on BiostatQuest: the Glossary. 70+ biostats terms — each with a plain-English definition, when to use it, the common mistake, and a one-tap jump into the case that trains it. Search any concept, measure, method, or bias in one place.
https://t.co/w5nbm5lZK7
Bismillah. Introducing @ScribeTools 2.0 : THE platform to transform your documents (Arabic/Urdu/English/etc) into actual usable knowledge!
It unlocks centuries of knowledge and allows you to interact with them in any way possible: search it, copy/paste it, throw it into an LLM, or whatever else!
Link is below
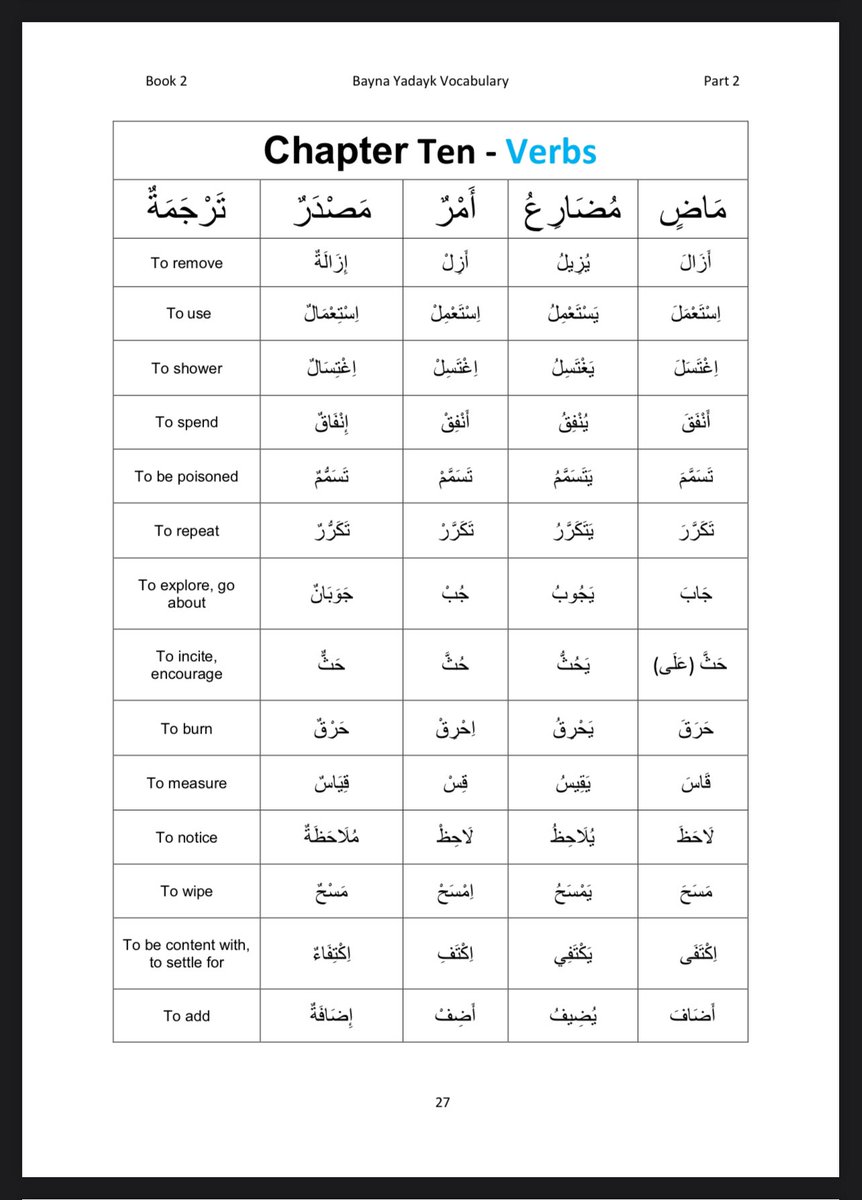
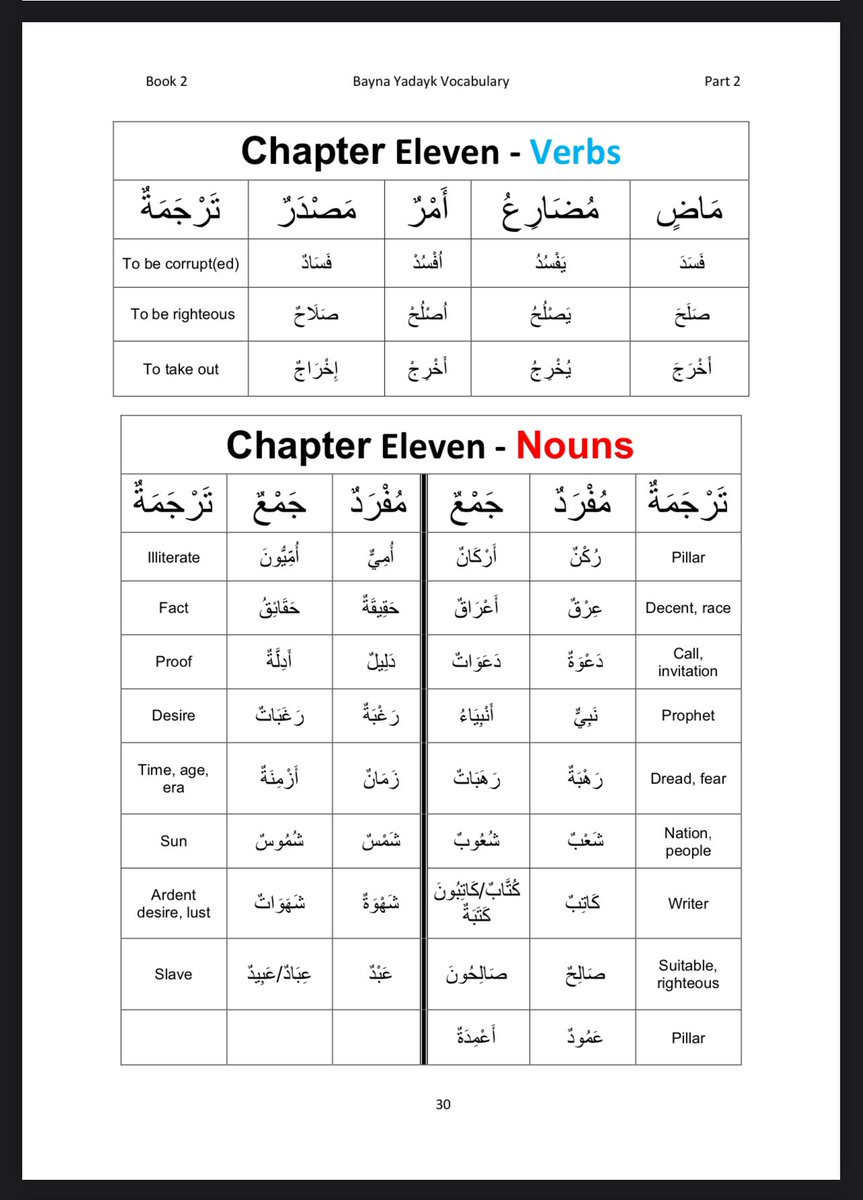
For those studying Arabic book series, Bayna Yadayk.
A student, may Allah reward him, compiled all the vocabulary from books 1-3 into a folder on Google Drive. Check it out 👇🏼
https://t.co/hZHfYhEcrM
Holy shit… someone just made machine learning click.
Not static diagrams.
Not math-heavy PDFs.
Not black-box training.
Real algorithms — training step-by-step — visually.
It’s called Machine Learning Visualized
and it lets you watch models learn in real time.
Here’s why this is different:
Instead of dumping theory first,
it shows optimization happening live:
• gradients moving
• weights updating
• decision boundaries shifting
• loss decreasing
• models converging
You literally see learning happen.
Everything is built from first principles:
• Gradient Descent
• Logistic Regression
• Perceptron
• PCA
• K-Means
• Neural Networks
• Backpropagation
No magic. Just math → code → visualization.
Each chapter is a Jupyter notebook
that derives the math
then implements it
then animates training.
So you can watch:
• neural nets shape decision surfaces
• PCA rotate feature space
• K-means clusters form live
• gradient descent find minima
• sigmoid reshape boundaries
• backprop update weights step-by-step
This solves a huge problem:
Most ML resources teach: math → code → ??? → trained model
This shows: math → code → learning process → result
Which means you finally understand:
• why gradients matter
• how weights evolve
• what loss landscapes look like
• how convergence actually happens
• why deep nets learn non-linear functions
Even better:
You can open any notebook
modify parameters
and watch behavior change instantly.
Learning ML becomes interactive.
Not passive.
Not abstract.
Not confusing.
Just… visible.
Perfect for:
• beginners learning ML
• devs moving into AI
• interview prep
• teaching concepts
• understanding backprop
• visual learners
• building intuition
This is the kind of resource
that makes neural networks finally “click”.
Link: https://t.co/i0k7LzGbJt
We’re moving from:
reading about ML
→ watching ML learn
That’s a big shift.
Because once you can see training,
you stop memorizing… and start understanding.
AI education just got visual.
This Data Science Handbook teaches real-world DS better than most courses.
And I'm giving it away for free (Only for First 4500) 🚨
Inside:
• Advice from 25 top data scientists
• Real career paths (Uber, Airbnb, LinkedIn, Facebook)
• How to break into data science without a degree
• Building real data products (not just models)
• Data science + engineering mindset
• Industry workflows & decision-making
• From beginner → production-level thinking
This isn't theory — it's how top data scientists actually work.
How to get it:
• Follow me (must so I can DM)
• RT + Like
• Comment "book"
I'll DM you 📩
🚨 This just became the most valuable free resource in tech.
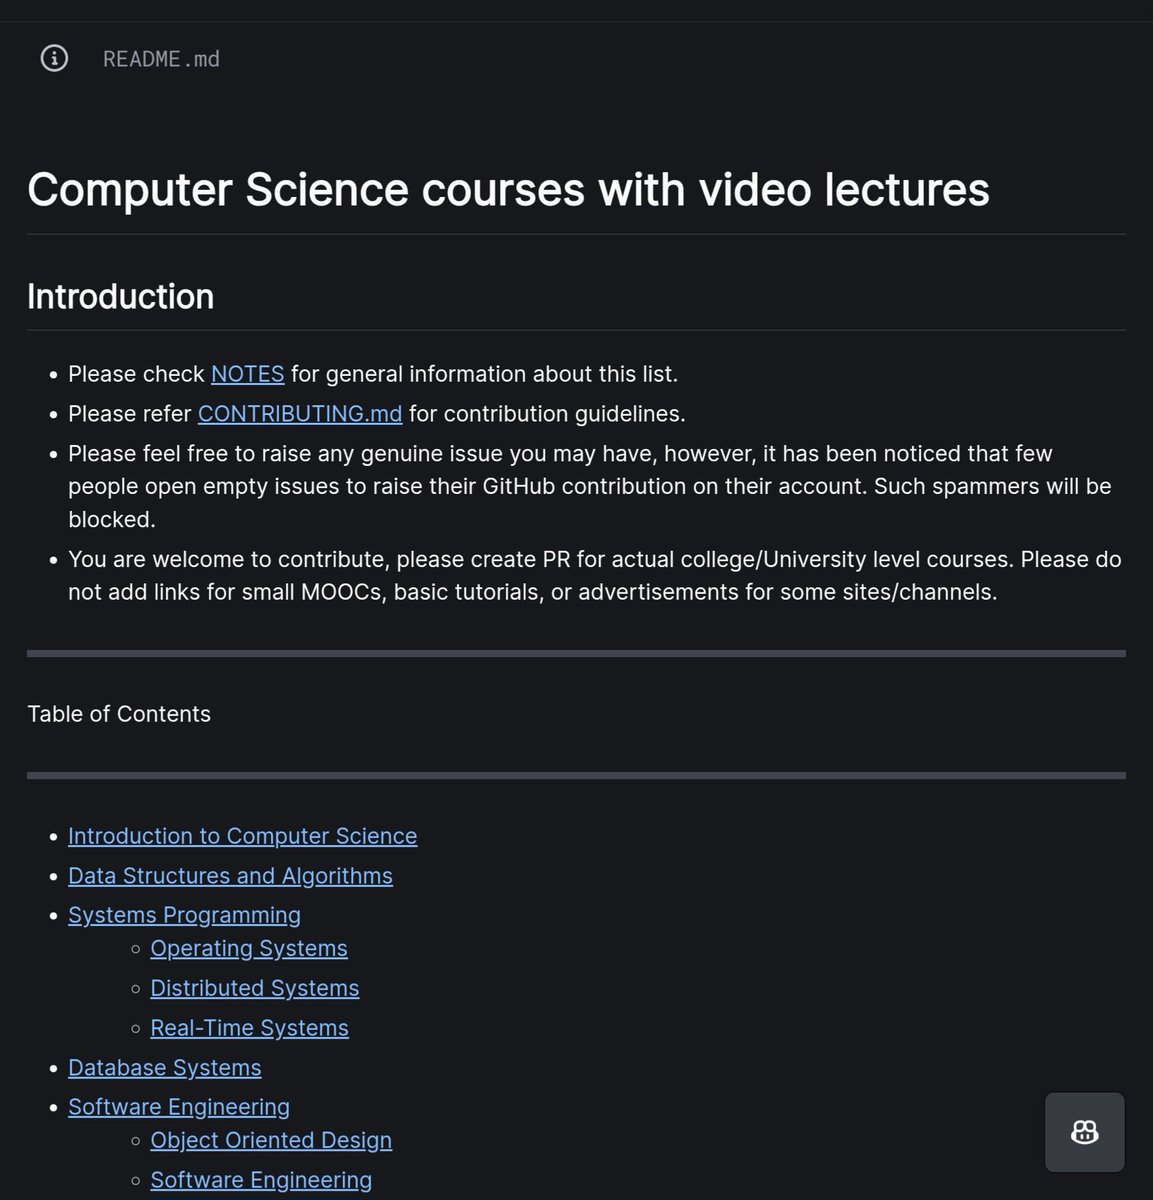
Every CS course from MIT, Stanford, Harvard, CMU, and Berkeley, compiled in one place.
500+ courses. 70K+ stars. Zero cost:
There is a Bangladeshi brother in our Masjid (I will not reveal his name as I don’t think he would want that). For many years, he has been purchasing items for the mosque and also giving me gifts. Every time he does, he repeatedly says he is sorry for disturbing me, and he does so in a way that no one can see him. I still cannot fathom the level of his sincerity and love.
Imagine someone gifts you something precious. They give it to you in a way that no one else is there, but then they humbly apologise for apparently disturbing you for a few seconds, and then they disappear without ever asking you anything. It reminds me of the beloved Ṣaḥābah, regarding whom our Creator says: “We feed you only for the sake of Allāh, seeking neither reward nor thanks from you” (76:9).
Sometimes people like this have such a connection with their Lord that they put individuals like me to shame. They are not noticed in society, nor do they have a social media presence, yet their sincerity can make one feel overwhelmed with emotion.
May Allāh grant us all sincerity. Āmīn.
It’s no surprise that large language models like ChatGPT are helpful for coding. What makes gptstudio stand out is how it brings that help directly into RStudio through a clean, user-friendly add-in.
gptstudio is an R package that integrates ChatGPT into RStudio, allowing you to generate code, explain functions, and write documentation using natural language, all without leaving your IDE. It supports various OpenAI models and offers an add-in panel that works like a built-in assistant.
This tool is especially useful when you're experimenting, writing boilerplate code, or just need quick answers while staying in your flow.
Advantages of using the gptstudio package:
✔️ Seamless integration into RStudio via an add-in panel
✔️ Helps generate and explain R code using plain language prompts
✔️ Supports multiple OpenAI models, including GPT-3.5 and GPT-4
✔️ Useful for both beginners and experienced users looking to speed up their workflow
Check out the GitHub page for more details: https://t.co/8jSGTHPxm6
Join my email newsletter for more tips on R, Python, statistics, and data science. For more information, visit this link: https://t.co/X93SeCe0rb
#RStats #Statistical #R4DS #DataAnalytics #Rpackage
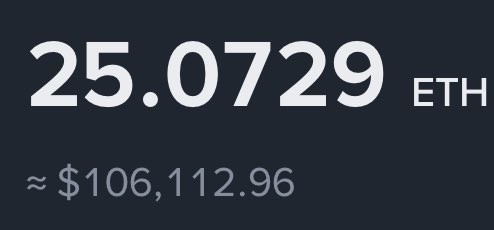
Ethereum hit $4200 today so as promised i will be giving away $2,500 ETH to 5 people in next 48hrs.
Like and repost this
Follow - @BullTheoryio
Join TG - https://t.co/UM9WIuccgs
If magically ETH hits $5,000 in next 48hr, I will add $10,000 more to this.
Finished updating syllabus and lecture slides for my intro undergrad course on applied stats and R.
See them here: https://t.co/YzNH7dSj94
Are you an instructor using DSS as your primary textbook? Email me for updated source files #rstats#AcademicTwitter
Highlighting important data in complex plots can be challenging, but gghighlight makes it simple. This ggplot2 extension in R allows you to focus on specific subsets of your data while keeping the context of the full data set, creating clear and impactful visualizations.
The attached visual, which I created with gghighlight, demonstrates its flexibility. The upper left plot highlights selected series in a crowded line chart, while the upper right shows a faceted view of these highlighted series. The lower left displays histograms grouped by categories with highlighted subsets, and the lower right shows a scatter plot with specific points labeled for emphasis. These examples illustrate how gghighlight helps draw attention to key elements in your data.
If you’re interested in mastering gghighlight and other powerful tools to improve your visualizations, check out my online course, Data Visualization in R Using ggplot2 & Friends. In this course, you’ll learn how to create impactful plots like these and take your data storytelling to the next level!
Learn more by visiting this link: https://t.co/ztlEzoEDWv
#tidyverse #RStats #datastructure #Rpackage #database #DataVisualization #DataViz #programming #datascienceenthusiast #ggplot2