Trading Hack
IPDA Data Ranges are built around the previous 3 candles.
Now switch to the 3D chart.
Can you identify what PRICE is revealing about the next potential manipulation?
Or are you still looking at candles without understanding the sequence?
REVEALED!!
ICT Taught This Only Once.
Across his mentorships, livestreams, and Spaces, this is one of the rare times he explained how he trades red folder events like CPI, NFP & FOMC.
IPDA Data Ranges are 60 - 40 - 20
That was taught to provide you life-cycle for my PD Arrays.
60 days look back Position setups.
40 days look back Swing setups
20 days look back Short Term setups
Day trades use all of them.
HOW I UTILIZE IPDA DATA RANGES
I'm dropping a very quality content for the weekend folks. Some examples on how I utilize IPDA data ranges in my trading. People love rule based things and I designed it that way 😎
THREAD... 🧵
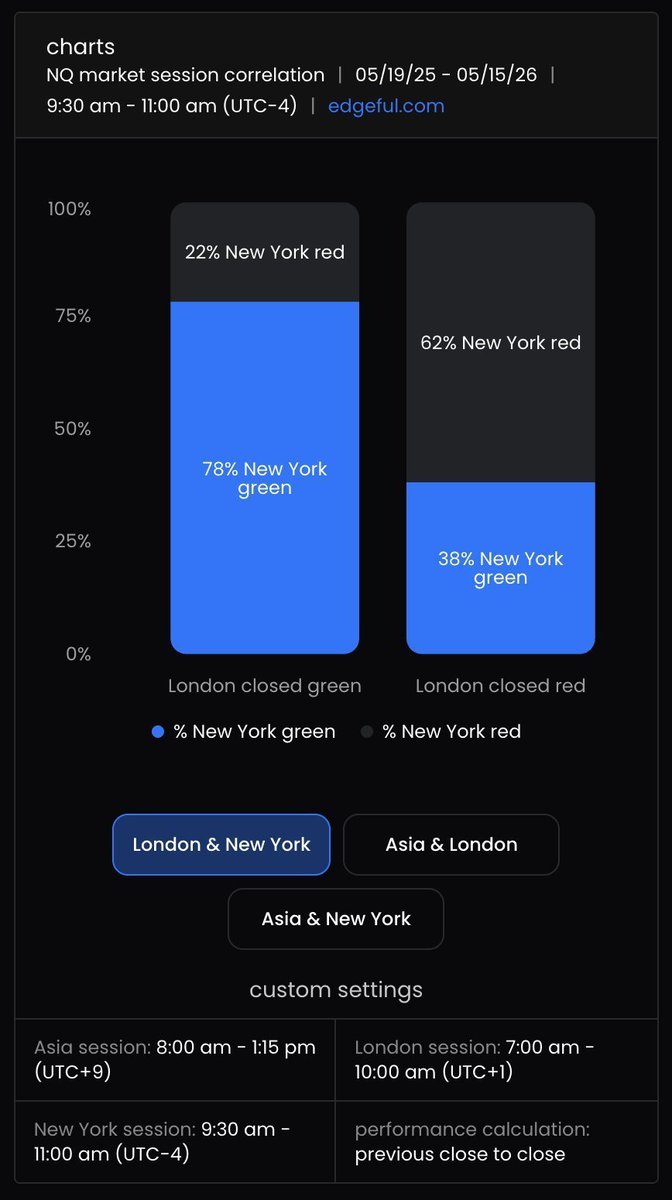
how to get the correct bias 78% of the time 📈
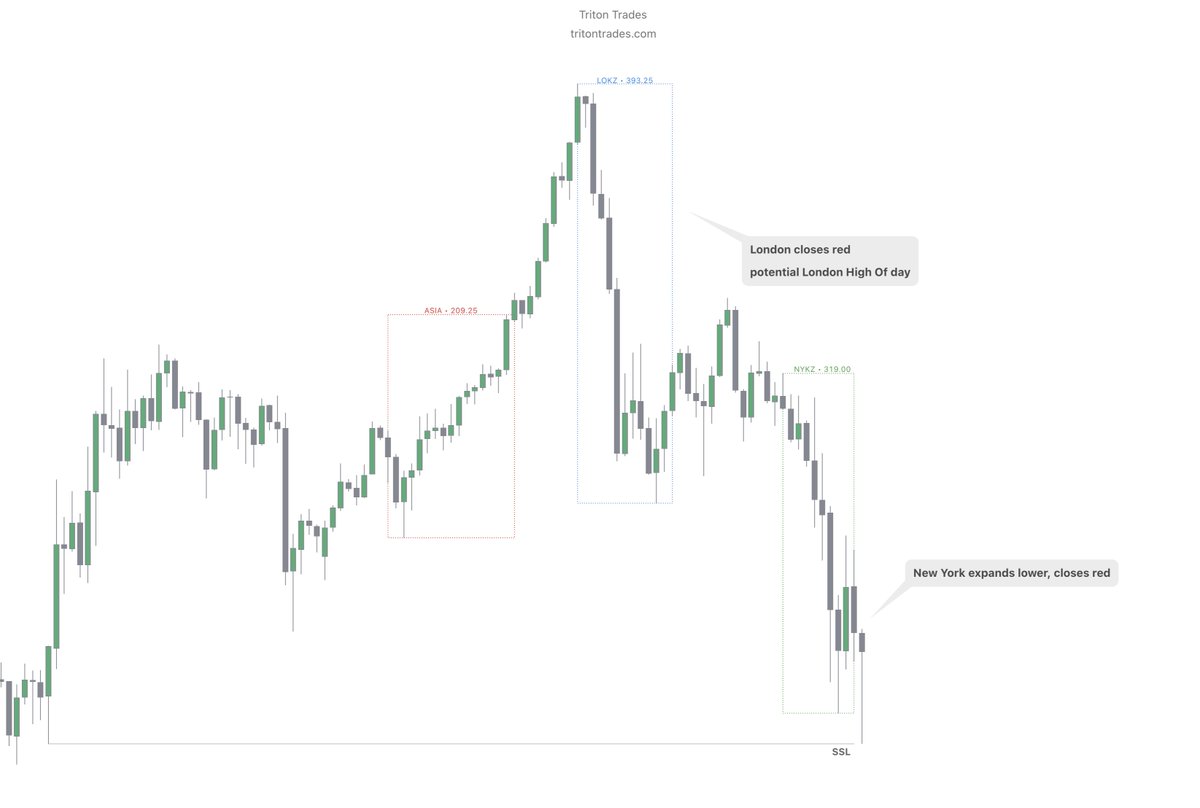
mark out London session:
- if London closes green > 78% chance NY closes green
- if London closes red > 62% chance NY closes red
this is the London high/low of day profile
backed by 1 year of historical data from Edgeful
Here is my indicator which i use to look for #Quartersequence for free.
Its a raw build and will get updates until i think its perfect for now enjoy using it💪
https://t.co/oVsbM4nXNb
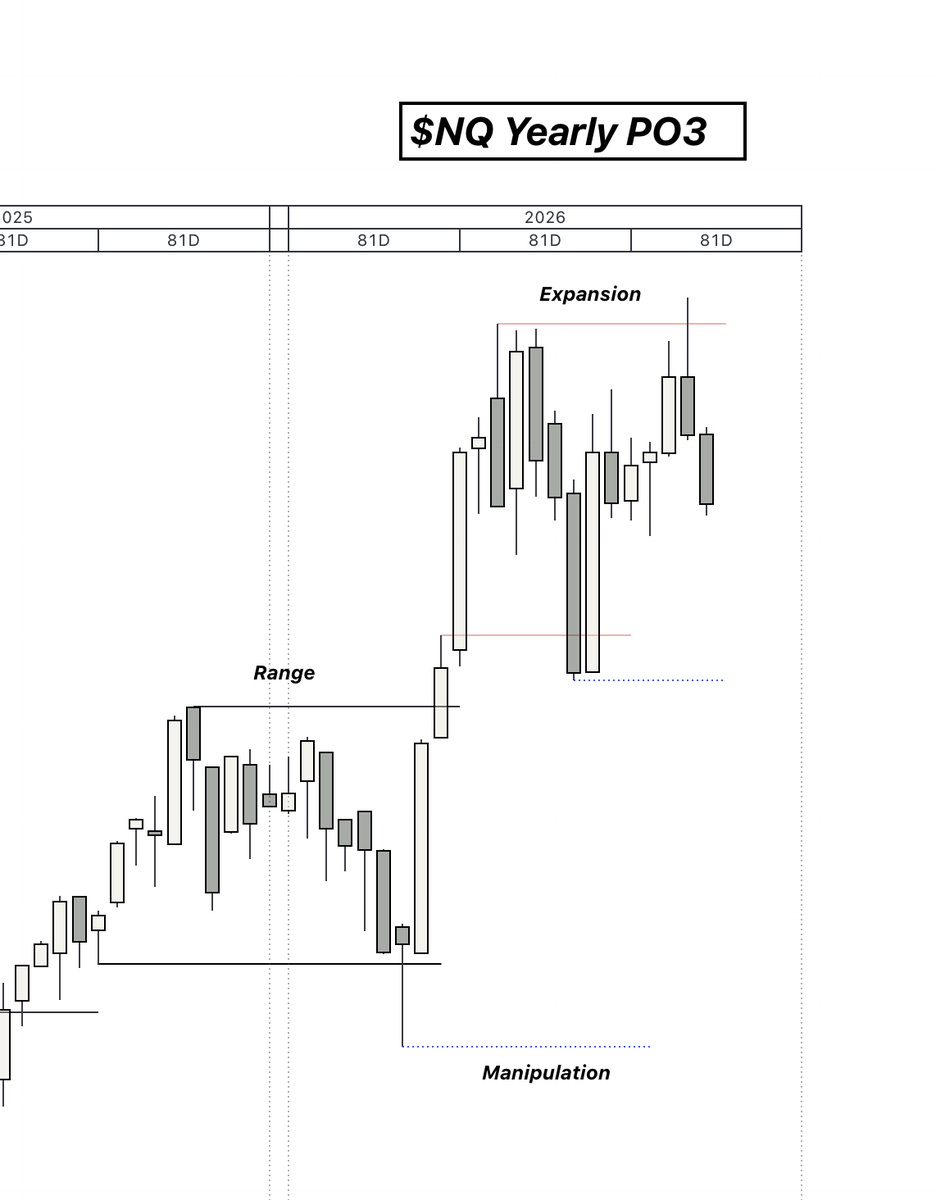
Sequence Of Sequences.
Simply observe its meaning first. Then move to the chart and observe the alignment of Sequences from the Yearly Cycle down to the Nano Cycle.
Nothing is random.
#sequenceofsequences