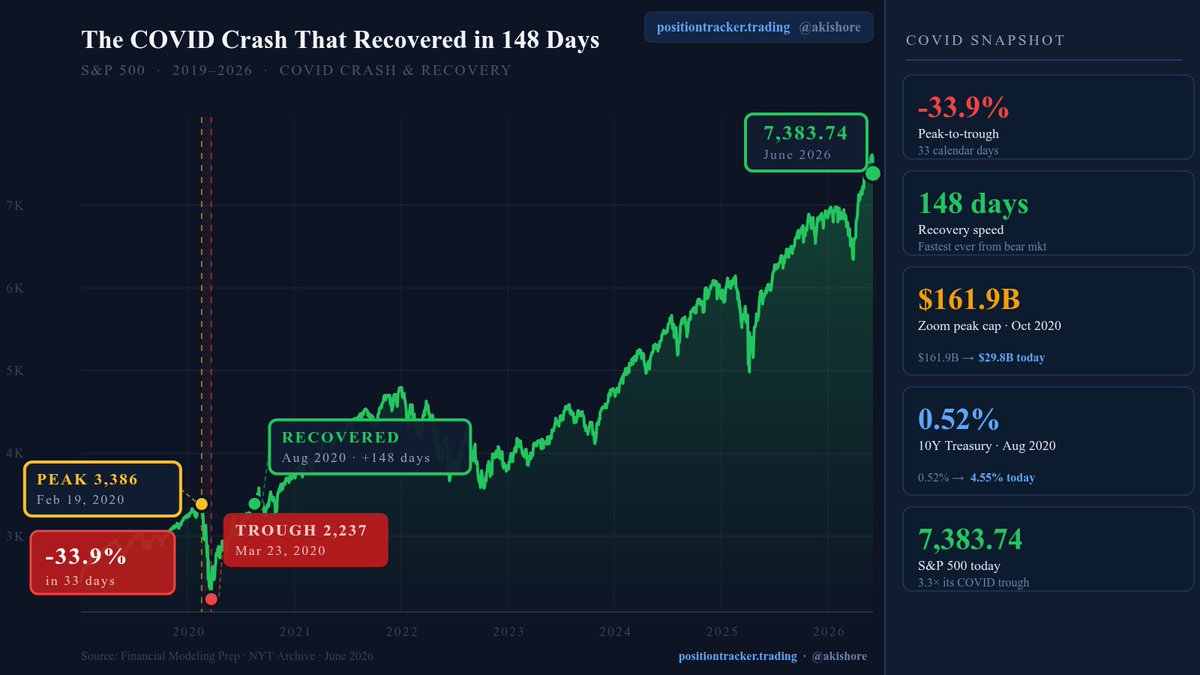
The S&P 500 now stands at 7,383 - 3.3× its COVID trough. Every major panic in market history has looked obvious in hindsight. March 2020 was no different.
Zoom's $ZM market cap peaked at $161.9B in October 2020, briefly exceeding the combined value of the entire US airline industry. Today, Zoom trades at a $29.8B market cap, down 82% from its peak. Delta Air Lines, grounded at $21/share in March 2020, trades at $82 today.
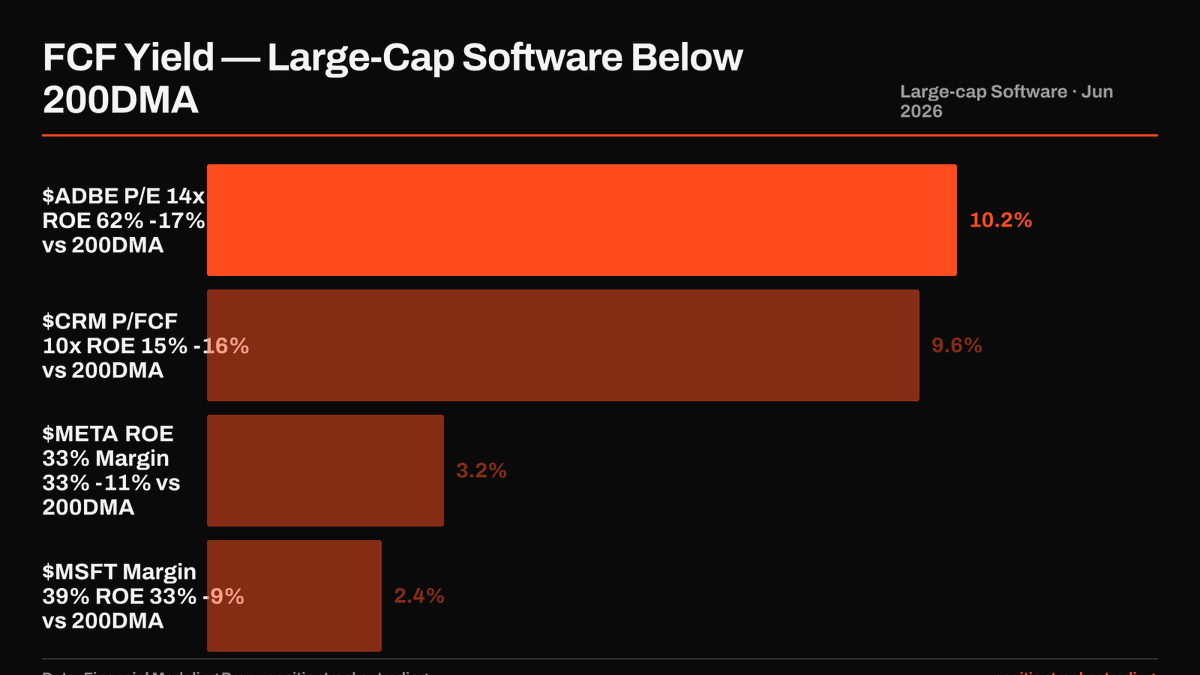
$ADBE's P/E is 14.3x. Its free cash flow yield is 10.2%. Its return on equity is 62%. The stock is down 39% in the past year and is 17% below its 200-day moving average. When fundamentals and price diverge this sharply, one of them is wrong.
The pattern extends beyond $ADBE. $MSFT, $META, and $CRM are all below their 200-day moving averages today. These four companies account for $4.9 trillion in combined market cap. All four carry a Buy consensus from Wall Street analysts.
$ADBE in detail: ROE 62%, ROIC 37%, FCF yield 10.2%, P/E 14.3x, trading 17% below its 200-day MA. Twelve analysts set an average target of $300 against a current price of $250, implying 19% upside. Consensus is Buy: 33 buys, 4 sells.
$MSFT: 39% net margin, 33% ROE, zero sell ratings among 82 analysts. Last quarter's analyst consensus target: $545. Current price: $412.50. That is 31% implied upside from the most widely covered software name on Wall Street.
$CRM: FCF yield 9.6%, P/FCF 10.4x. Analyst average target $270 versus a current price of $184, implying 45% upside. Buy ratings outnumber sells 75 to 2. The company returns nearly $0.10 of free cash flow per dollar of current price.
The common thread: ROE, ROIC, and FCF yields are intact across all four names. Analyst consensus has not degraded. What has changed is price. The data shows a divergence between market price and business quality that is visible in every fundamental metric.
What to watch: $ADBE's next earnings, specifically whether FCF yield holds above 9% and ROE stays near 60%. For $MSFT and $META, Q2 margin reports will show if AI investment is converting to earnings. Data sourced 2026-06-05. Not financial advice.
The broad takeaway: 2026 is shaping up as an EPS recovery year, but the growth is narrowly concentrated.
Energy and select AI-linked Tech are where analyst upgrades are accelerating fastest. Healthcare and Consumer staples are being revised down.
The market is already pricing some of this. The question is how much.
The biggest EPS contractions in 2026:
$MRK: −42.5% (Keytruda patent cliff approaching)
$NKE: −30.5% (consumer slowdown + China exposure)
$CMCSA: −13.1% (cord-cutting accelerating)
All three are large-caps with structural headwinds, not cyclical ones.
I have no clue what I’m talking about but frankly doesn’t seem like anybody else does either. But just looking at bitcoin:native from an Elliot wave theory point of view, you could definitely see how it looks like we’re about to hit wave C. Down to $45K at least.
THE STOCK MARKET JUST DELIVERED ANOTHER WILD SESSION.
Here's your recap:
1) The Nasdaq got smoked today: it closed at 25,709.43 (-4.18%), while the S&P 500 finished at 7,384.67 (-2.63%). A hotter May jobs print (172K vs 80K expected) reset rate expectations higher, with the 10Y ending around 4.55%, and high-duration AI/semis were the pressure point.
2) $NVDA fell to $205.10 (-6.20%) on ~216.8M shares (mkt cap ~$4.97T). The selloff was part of the broader 'higher-for-longer' repricing after the jobs surprise, with traders de-risking the AI complex as yields jumped.
3) $AVGO slid to $385.73 (-7.92%) on ~50.7M shares with the market still digesting Broadcom's AI-chip guidance shock from earlier this week. Wall Street has been treating AVGO's outlook as a bellwether for the 'AI capex' trade, and the weak guide kept semis under pressure into the close.
4) $AMD closed at $466.38 (-10.86%) on ~46.2M shares as the chip unwind accelerated. CNBC tied the continued weakness across AMD/Intel/Arm to the same Broadcom-driven 'AI forecast' disappointment that kicked off the sector selloff this week.
5) $MU ended at $864.01 (-13.25%) on ~74.7M shares, extending the memory-stock drawdown. CNBC noted Micron was one of the names hit hardest in the two-session fallout after Broadcom's forecast didn't clear the market's AI 'whisper' bar, dragging memory and chip peers with it.
6) $LULU sank to $114.23 (-8.56%) on ~16.1M shares after the company cut its annual outlook and flagged another decline in U.S. sales. WSJ said the guidance cut pushed the stock to its lowest level since 2018, underscoring how quickly the premium-apparel demand narrative has cooled.
7) $DOCU finished at $47.26 (-7.22%) on ~8.7M shares even though the quarter beat; the tape focused on the outlook. CNBC highlighted the company's Q2 revenue guide of $865M–$869M (roughly in-line with $866M consensus) as 'not impressive enough' for a market that's punishing anything less than upside.
8) $MSTR closed at $120.44 (-6.90%) on ~41.2M shares as bitcoin broke below $60K intraday (low ~$59,764). CNBC framed the move as part of a broader risk-off week for crypto, with sentiment hit after Strategy's earlier small BTC sale and no sign of dip-buying as prices slid.
9) Paramount ($PARA) fell to $11.04 (-6.04%) while $WBD ended at $26.24 (-2.81%) on ~49.4M shares as merger risk re-priced. CNBC said a coalition of states is preparing a lawsuit to try to block the proposed Paramount–Warner deal, putting the timeline back in question.
10) Options volume exploded on the risk-off tape: the top 10 most active option tickers were $NVDA 5.48M, $TSLA 4.42M, $AAPL 1.87M, $MU 1.76M, $MSTR1.19M, $AMZN 1.15M, $META 938K, $INTC 930K, $MSFT 918K, $NOK 866K. Semis + high-beta tech dominated the list, with $NVDA alone at 5,482,291 contracts and $MU still printing 1,763,738 despite the drawdown.
11) Unusual flow popped up in $TSLA: the TSLA Jun 08, 2026 840.00 call traded 25,631 contracts with only 18 open, a volume/OI ratio of 1,423.94. That kind of same-day positioning showed up as Tesla slid -6.56% to $391.00 on ~61.7M shares in the broader high-duration unwind.
12) The options market is pricing 'event risk' in $MRVL: IV Rank hit 106.97% with 30-day implied volatility at 111.92%. That's showing up while the stock cratered -16.74% to $263.47 on ~87.4M shares in today's chip-led selloff, making hedges dramatically more expensive.
13) Even with the S&P down hard, defensives caught a bid: the best sector today was Healthcare at +0.19%, while the laggard was Energy at -5.65%. CNBC explicitly called out a rotation into consumer staples as traders fled chips/AI, with Procter & Gamble surging more than 5%.
However, for investors, remember that just because a sector is shrinking does not mean it's not going to give you a good return.
The best stocks in a shrinking sector tend to outperform most stocks in a fast growing sector.
Read The Future for Investors by Jeremey Siegel.
https://t.co/dYFwFUw9ve
Historical Post of the Day:
In 1980, Energy was the single largest sector in the S&P 500 at 28% of the index.
Today, it's 3.5%. Here's the greatest sector rotation in market history:
Every era gets the market it deserves.
In 1980, the world ran on oil and the stock market reflected it. In 2026, the world runs on software, semiconductors, and advertising algorithms.
The sector weights are simply the market voting on what it thinks the future looks like.