Haranga Resources: Two Projects, One Massive Valuation Gap
https://t.co/FQO0YqUwB8
Haranga Resources: Two Projects, One Massive Valuation Gap
Two major discoveries, a full DCF re‑rate, and a market still pricing Haranga as if nothing has changed.
https://t.co/uU7W38jcKy
June is a rather lacklustre month for equity market performance (particularly beyond the first few days) with the S&P 500 Index averaging a return of 0.6% and a gain frequency of 64%. https://t.co/LkkkW5BAGG $SPX $SPY $ES_F
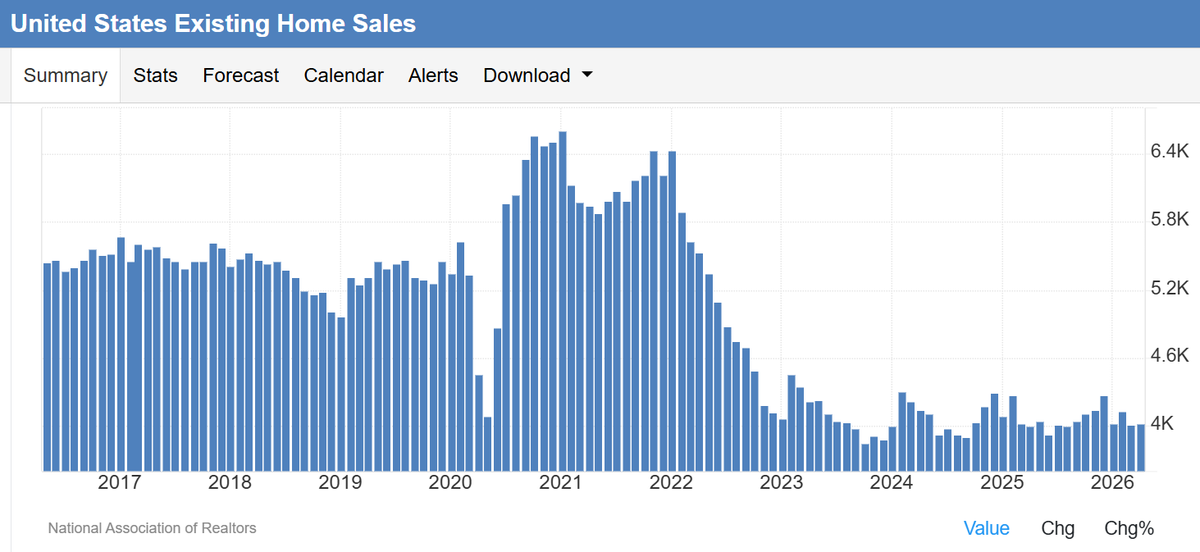
Despite sluggish existing/new home sales, along with a poor trend of sales prices, through the first quarter of the year, Case-Shiller seems rather upbeat in their gauge of the value of the largest asset of most Americans. The Case-Shiller Home Price Index increased by 1.4% (NSA) through the first quarter of the year. While below last year's pace, the rate is still above the seasonal norm that calls for a mere 0.4% increase through this timeframe. $STUDY $MACRO $ITB #Economy #Housing
The green private domestic sector balance line leads the red stock market line downward in the coming month after a massive record breaking run up from the Iran war lows.
The private sector printed a big red deficit in April, and this does not bode well for markets in May especially after the big run up from the Iran war retrace.
Warren Buffett’s Berkshire Hathaway ($BRK.B) continues to increase its cash reserves.
In the last major cycle, Berkshire raised cash years ahead of the market peak, sitting on nearly 25% cash prior to the 2007 top.
Today, cash sits at ~30% of total assets, higher than pre-Global Financial Crisis levels.
Even as markets rally, Berkshire is sitting it out and building liquidity, stockpiling cash at record levels and pushing it to ~30% of assets (see charts).
Fewer opportunities lead to more selling. Cash builds.
Better to be early than late.
Follow us @OakleighIM for more insights.
Diversification outside the US still makes sense here.
Following liberation day, the rest of the world has outperformed the US at an unprecedented pace.
The Iran conflict gave a short reprieve (dollar rally) but it looks like the next leg of the trend change is underway.
Returns follow flows, not economic activity & earnings.
By the time the headlines say the economy is heating up most of the move has already happened because what most of macro measures is a consequence of, not the cause of, fiscal and credit expansion.
The biggest move in returns comes directly from fiscal. Fiscal also supports credit expansion which in turn caries the cycle along as fiscal fades.
This cycle began in late 2022 because of the massive fiscal add from the rate hikes. That was the time to get bullish and excited about a huge run. Now is the time to be vigilant, looking for policy decisions and shocks that may bring an end to the fiscal support and work against credit growth.
On our revised forecasts (issued March 2026), we are now down to two scenarios.
If the cash rate peaks at this point, we are looking at price changes at the bottom end of our range for our base case scenario.
That means I am now expecting Sydney housing prices to fall towards 6%. Melbourne housing prices are now expected to fall towards 4%.
The other cities are now expected to record signs of slowing but I am still expecting prices to be up for the year for these cities given their income exposure to rising commodity, precious metals and energy prices.
Now in truth, the probabilities have increased that Scenario 2 is the path. Afterall, it will only take one more rate rise to have it in play. That would mean deeper falls this year in Sydney and Melbourne and a larger slowdown elsewhere.
Note, these forecasts do not take into account property tax changes. And they are not peak to trough expectations. Just changes for the Calendar year 2026.
There is still of course a possibility the RBA may have to cut at some point this year. Say for example we have a recession and/or an equities crash. Even if they did, it's now unlikely our forecasts would hit their mark under Scenario 3